
Admin Dashboard
-
Overview
The Admin Dashboard serves as the central hub for managing all critical aspects of your institution’s operations within the CRM. From this dashboard, administrators can efficiently view and manage student and lead information, monitor the admissions process, oversee communication workflows, and track key performance tasks. Use the Admin Dashboard to simplify daily activities, gain actionable insights, and enhance the overall efficiency of your educational organization.
-
How to navigate the admin dashboard?
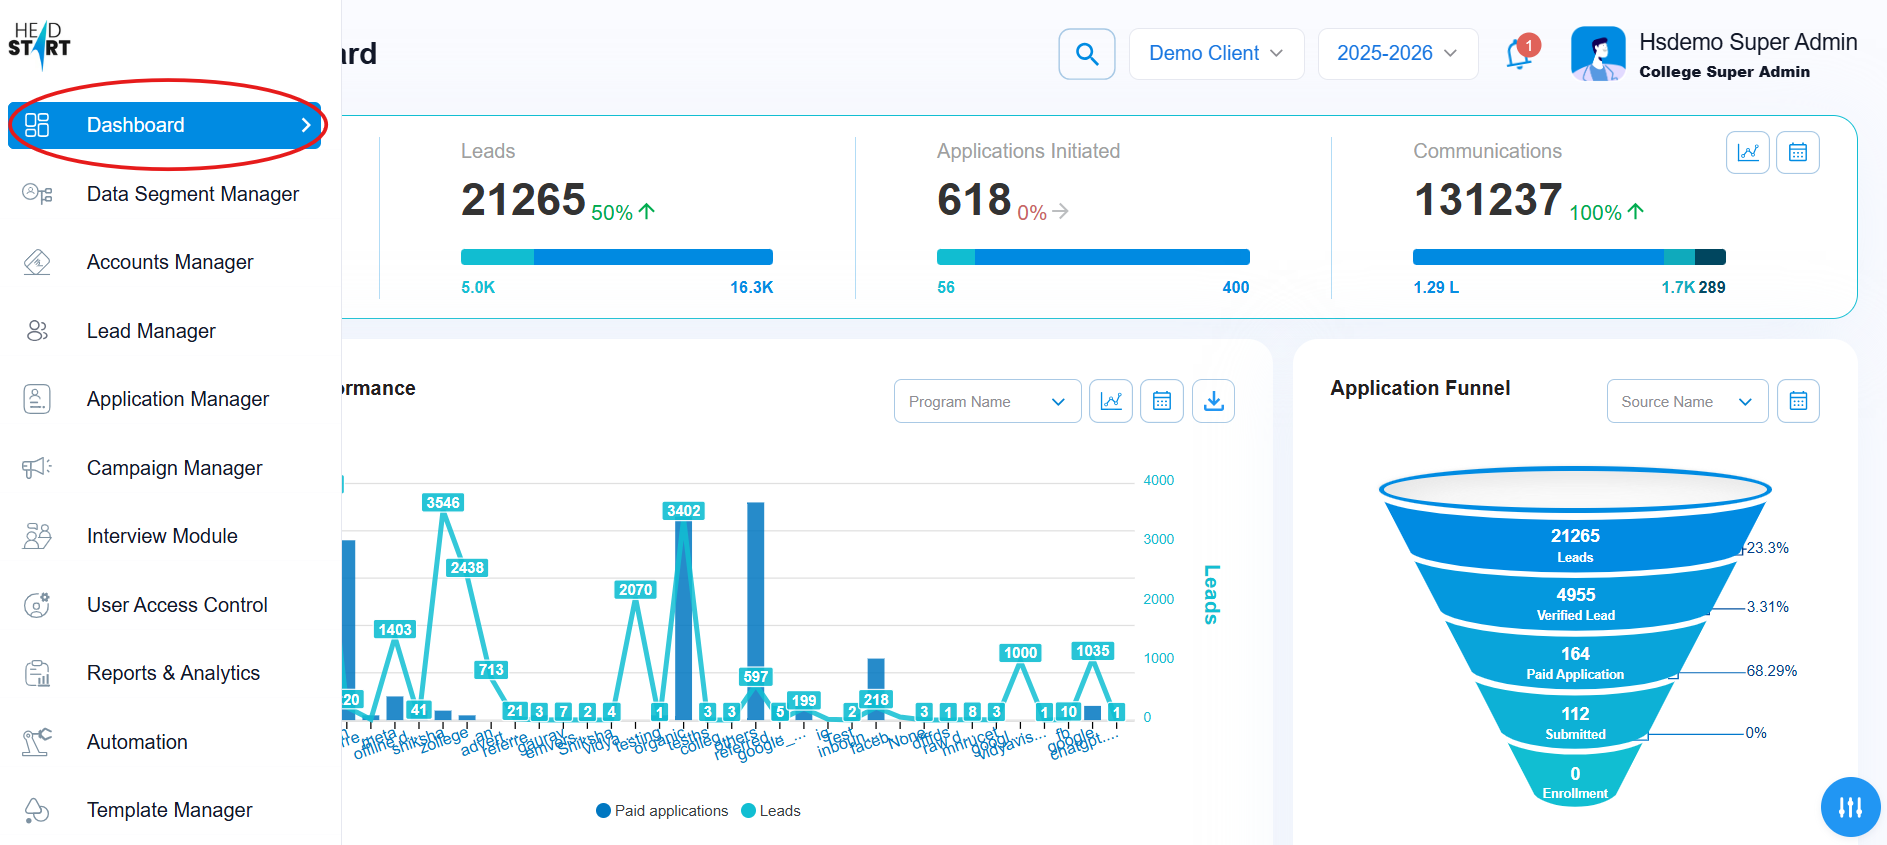
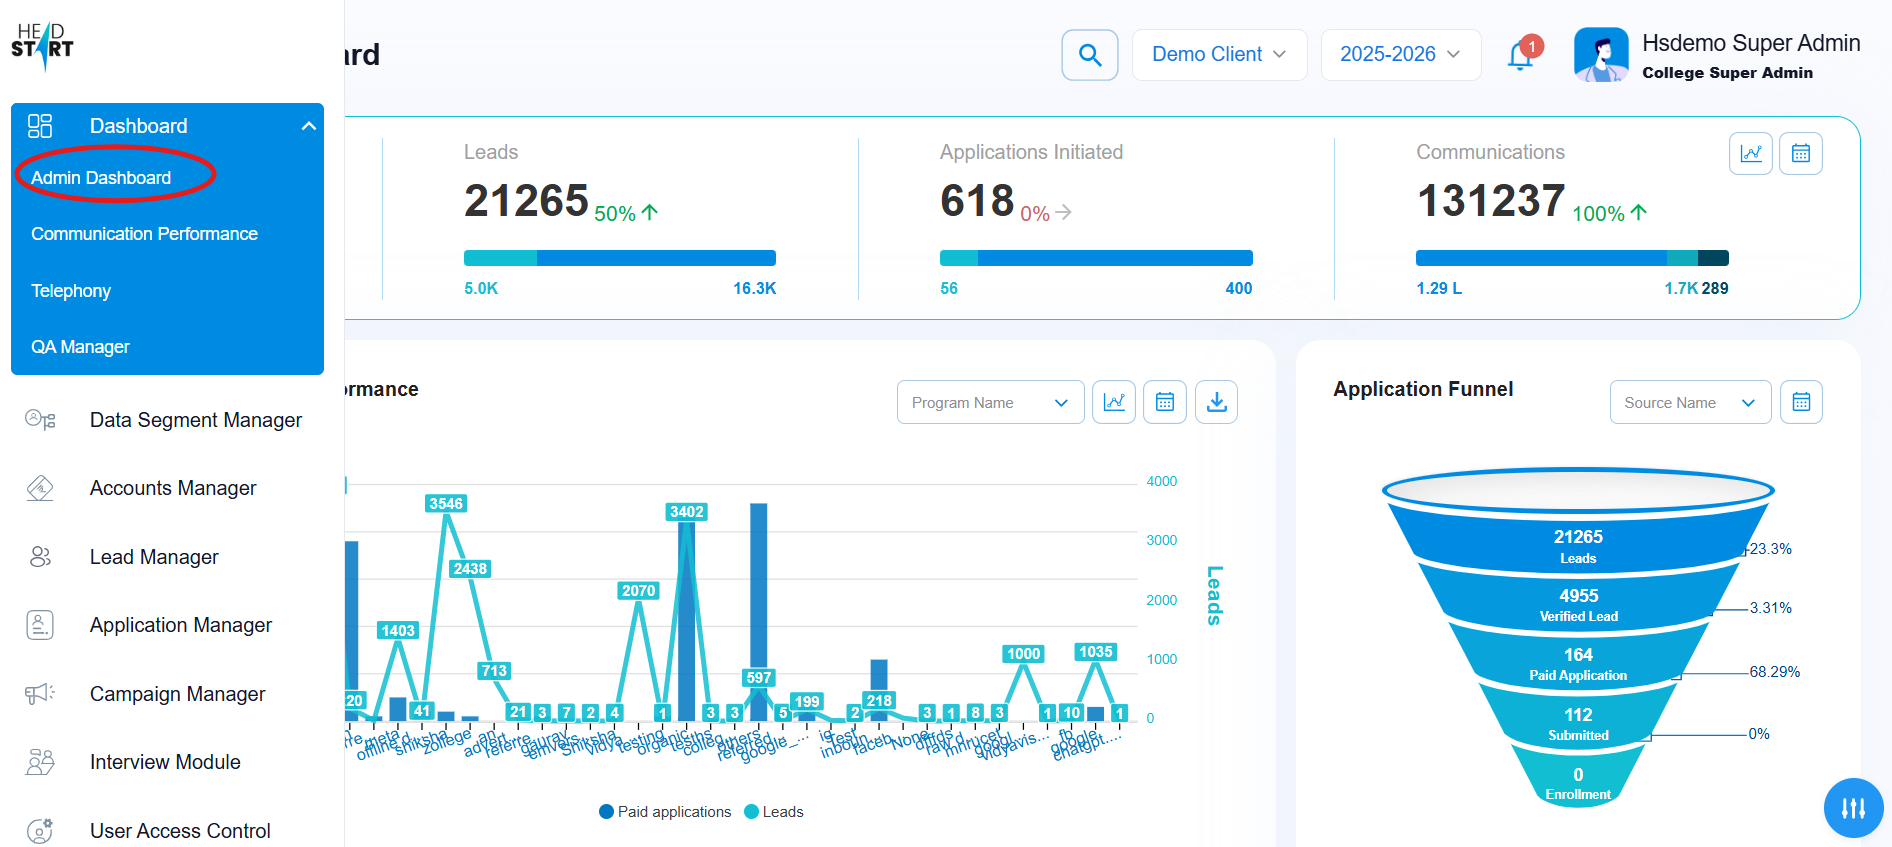
To access the Admin Dashboard, the user should navigate to the side panel of the CRM and select the “Dashboard” option (IMG 1.1). Upon clicking “Dashboard,” a series of sub-modules will be displayed. Among these, selecting the “Admin Dashboard” sub-module will direct the user to the main Admin Dashboard interface (IMG 1.2).
IMG 1.1
IMG 1.2
Global Header
-
Search Option
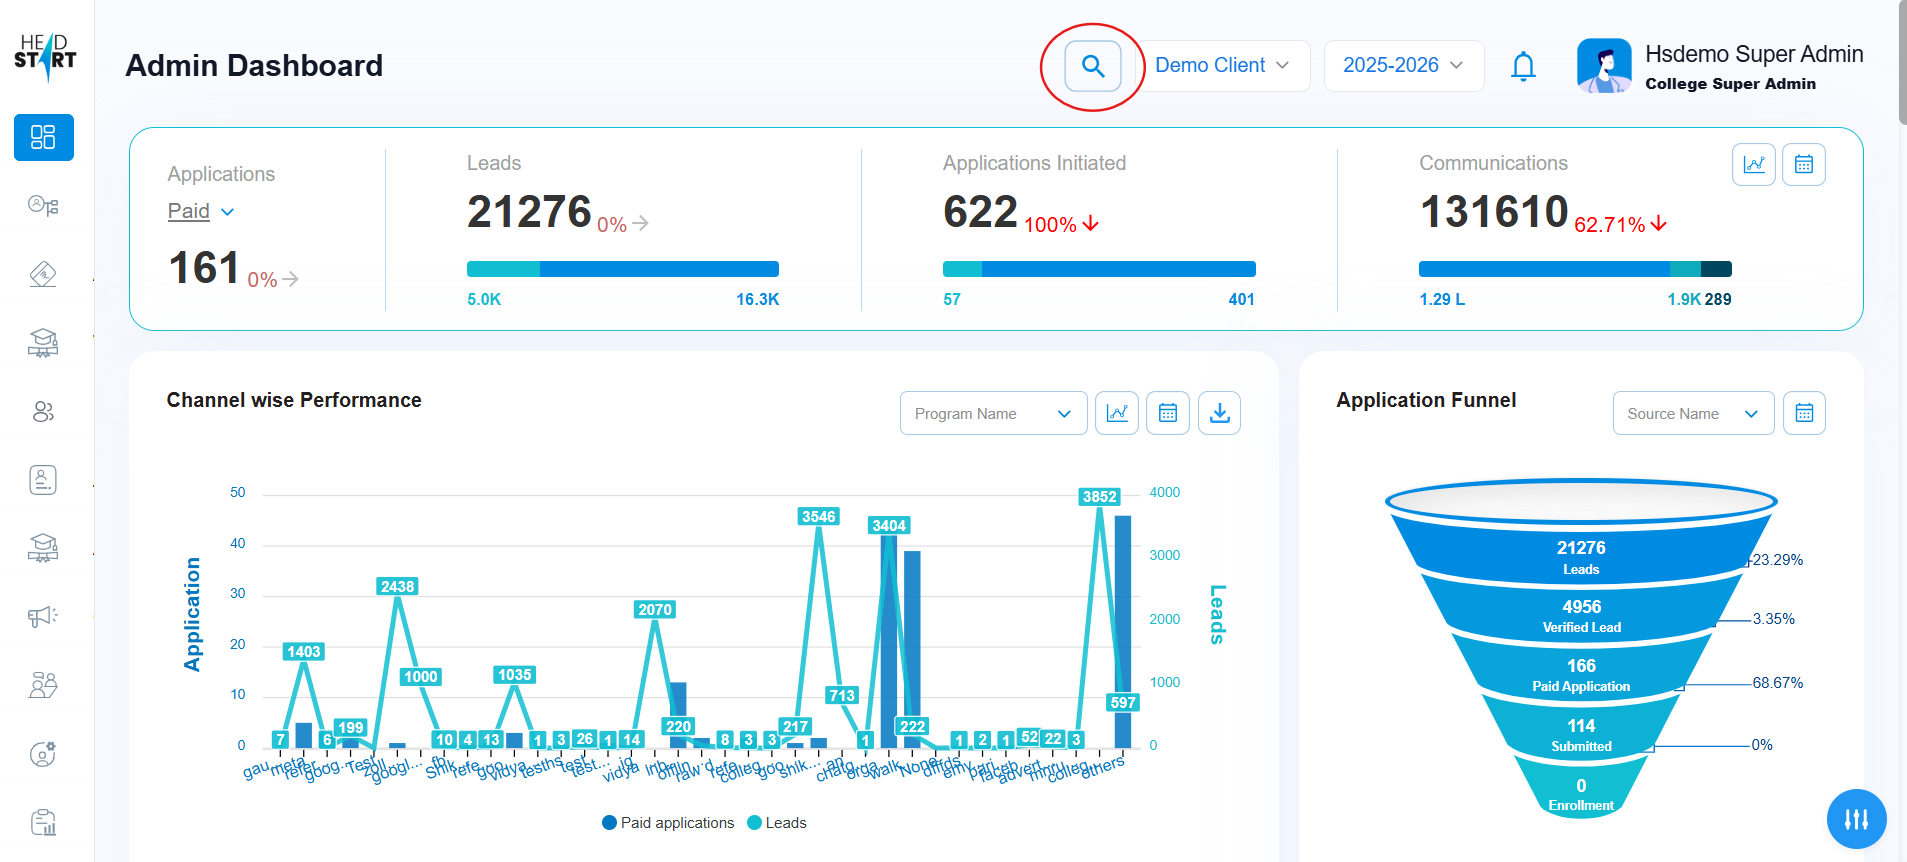
At the top of the admin dashboard the search option is available, wherein the search is an elastic search which means the admin can search for any leads in the system. The admin can search any lead on the basis of its lead name, leads phone number, leads email id, leads application id(IMG 1.2a)
IMG 1.2a
-
College Dropdown
At the top of the dashboard, the admin can use the College dropdown to select a specific college, and the dashboard updates to display data for the chosen institution(IMG 1.2b)
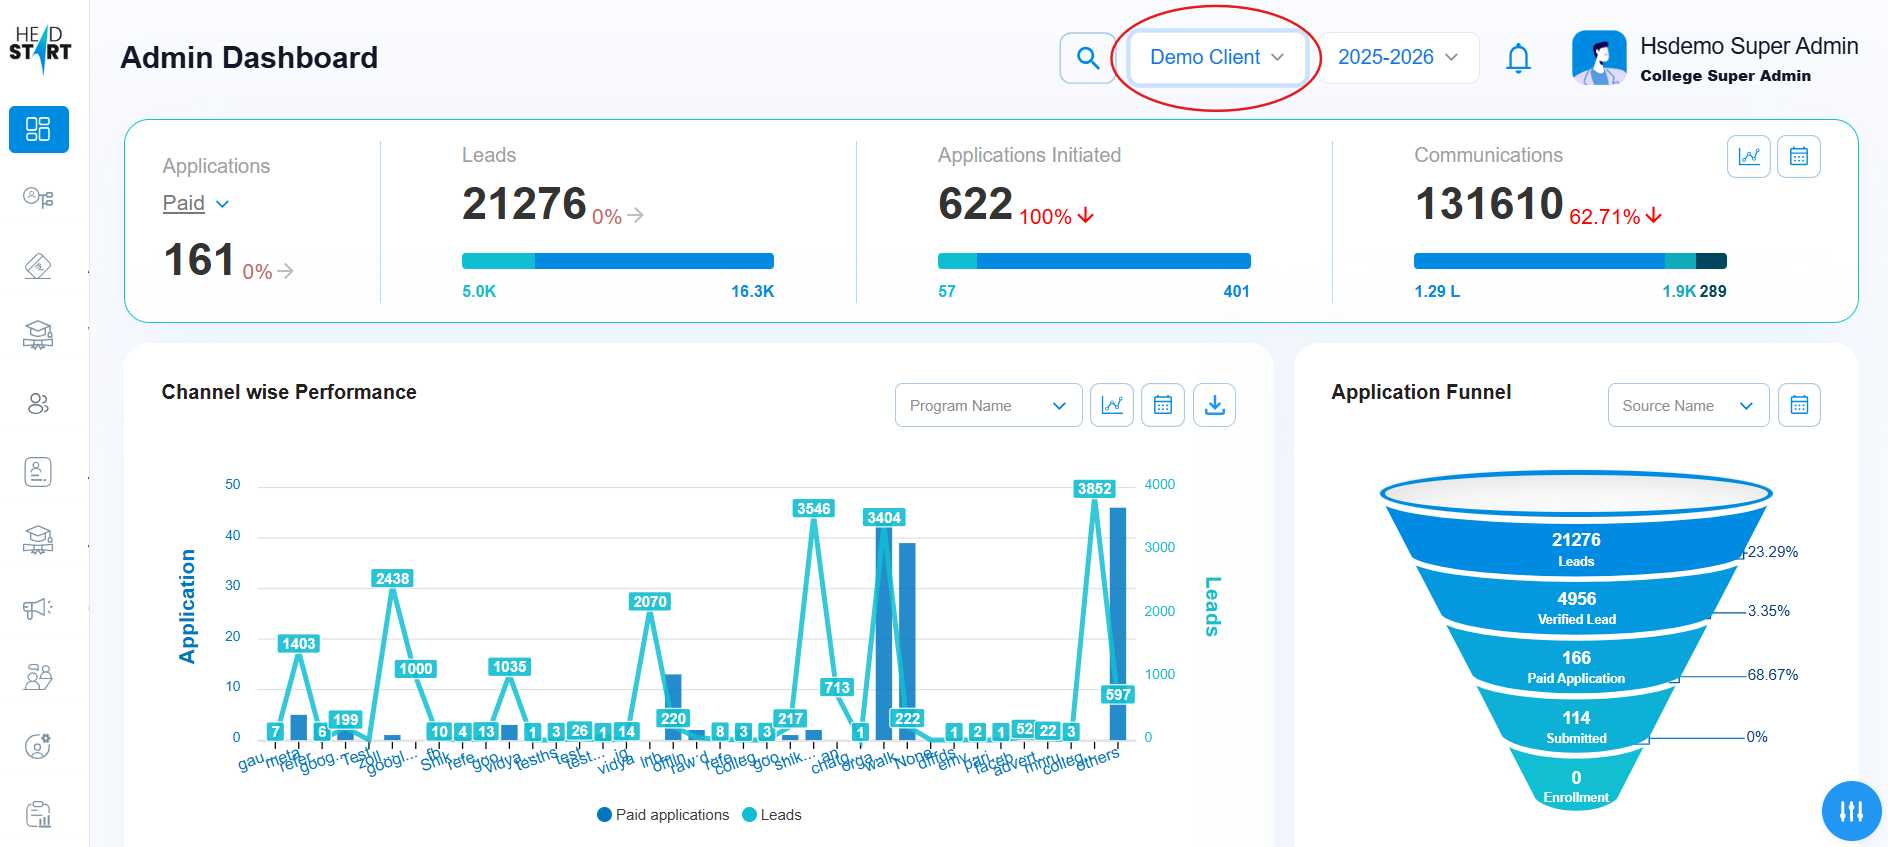
IMG 1.2b
-
Selection of Session
The admin selects an academic session from the Session dropdown, and the dashboard updates to display data for the chosen year(IMG 1.2c)
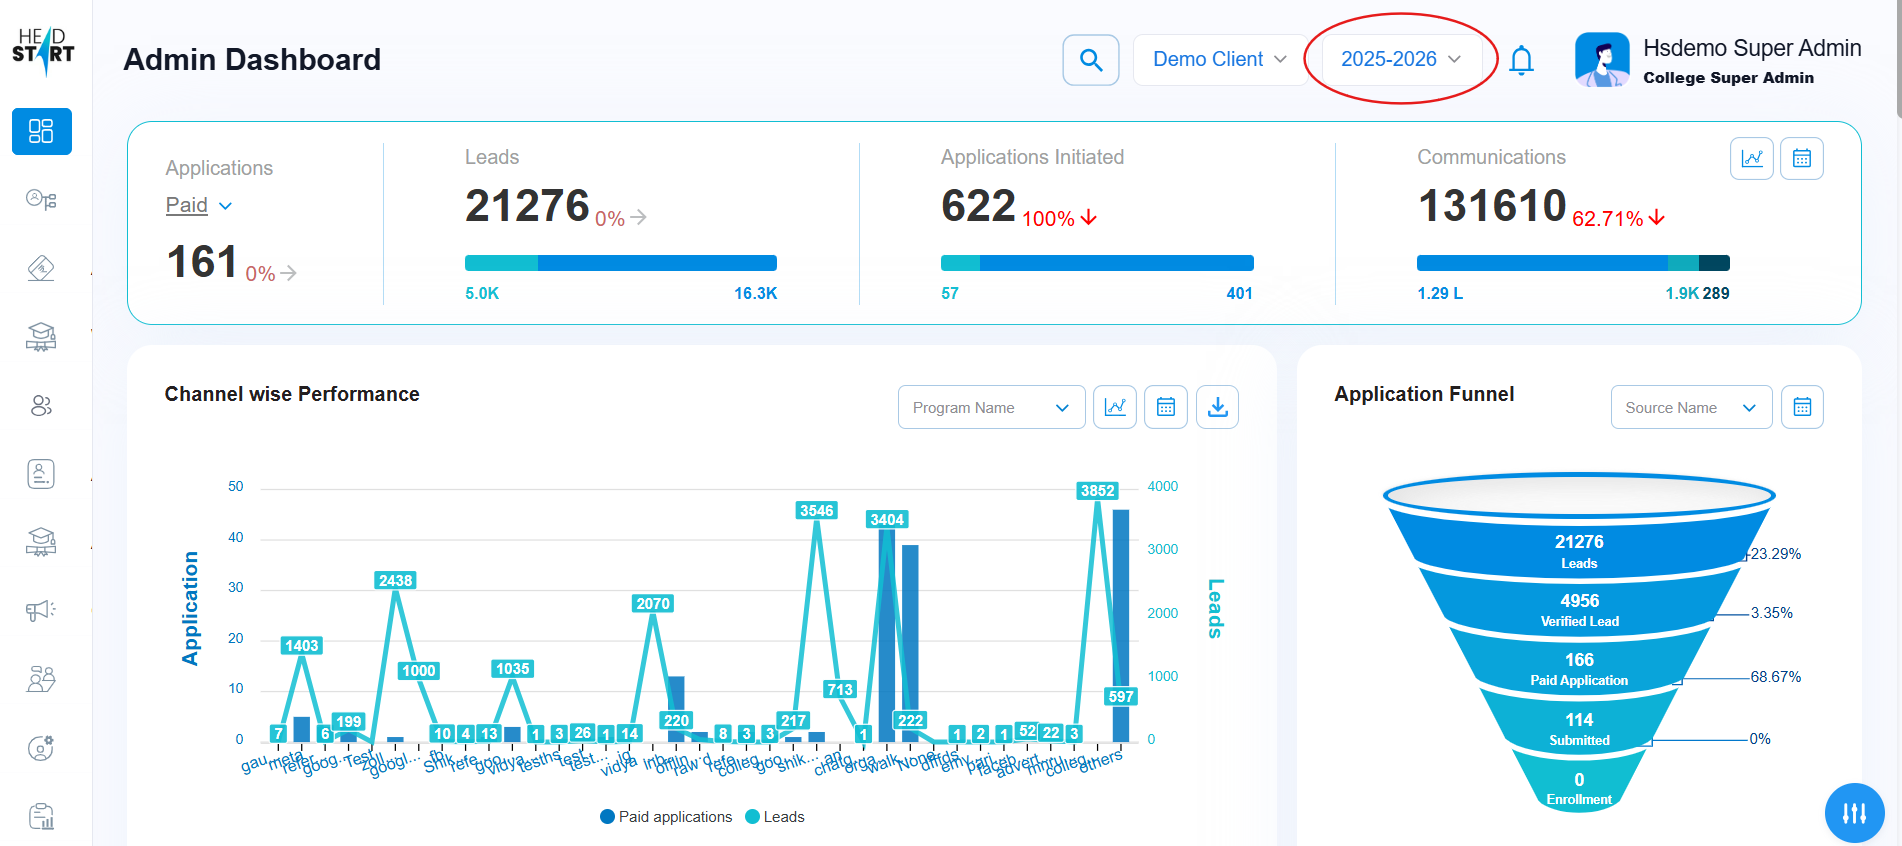
IMG 1.2c
-
Notification
All updates for admins and counselors are displayed in the Notifications section, represented by the bell icon. Any changes or new updates made in the system will trigger a notification, which can be accessed by clicking the bell icon(IMG 1.2d)

IMG 1.2d
-
Profile Selection and Setting
Admin Dashboard(Features and Functionality)
-
Top bar of admin dashboard
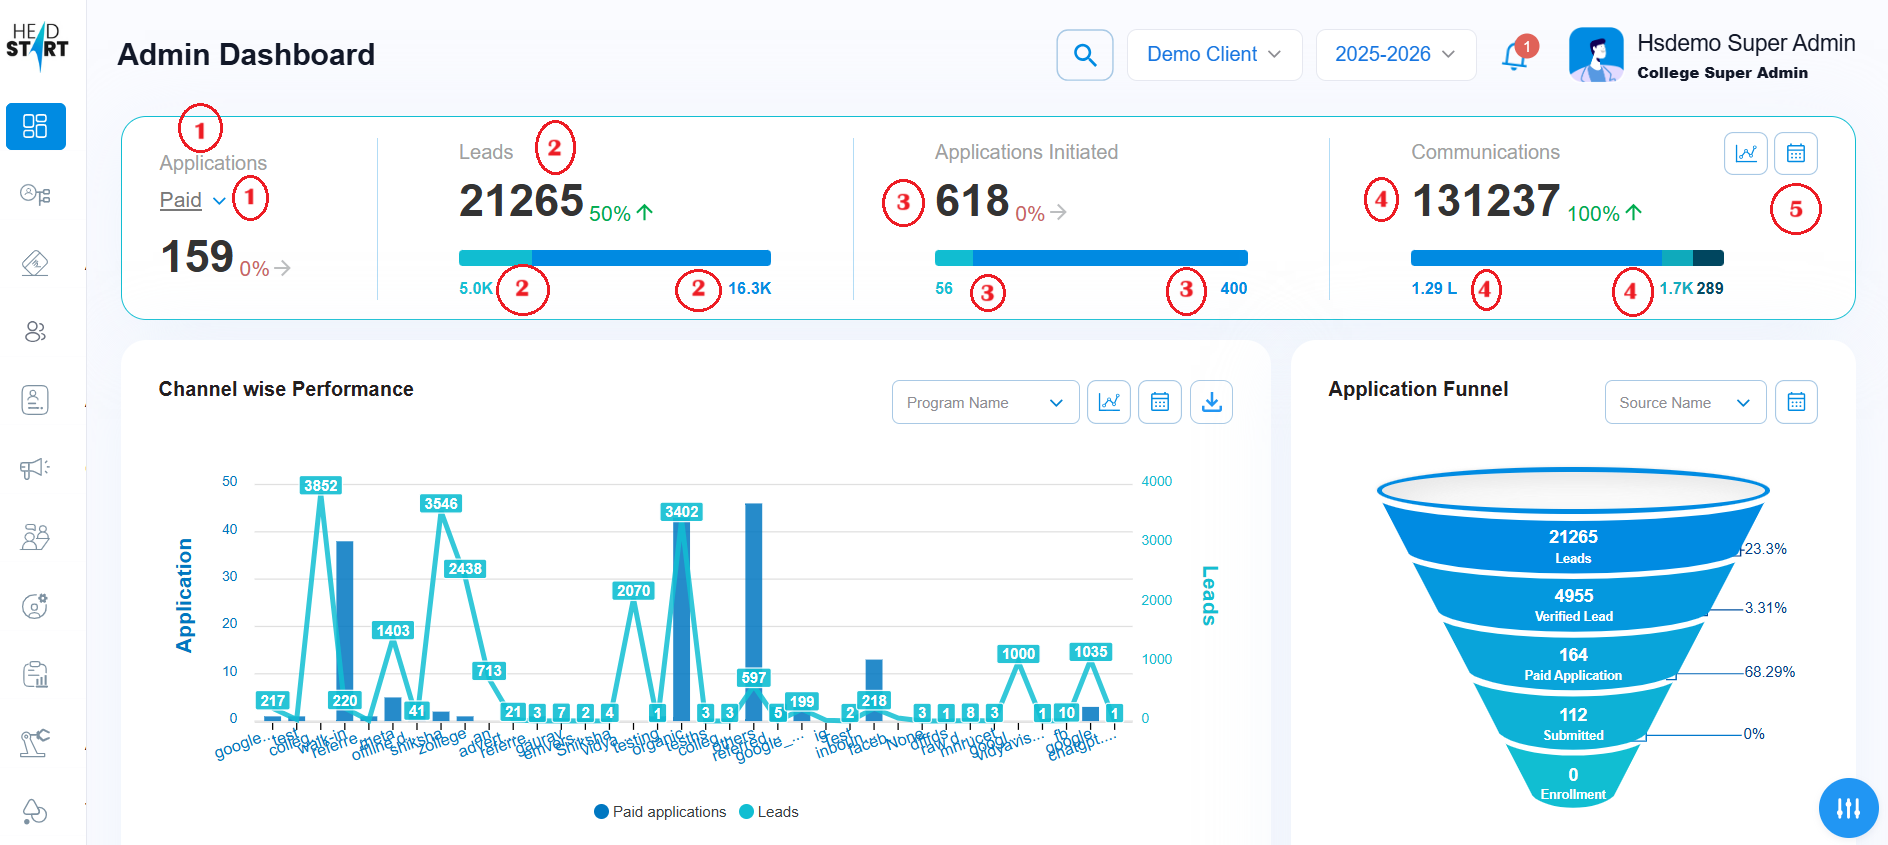
The top bar of the admin dashboard displays key information that is available within the system. The information displayed is(IMG 1.3):-
- Applications – On the top bar of the admin dashboard, the total number of paid applications is prominently displayed. Users can click the downward arrow to view a detailed breakdown, which includes the counts of paid and submitted applications.
- Leads – The total number of leads is displayed in this section. By hovering over the bar located just below the total lead count, users can view a breakdown that includes both verified and unverified leads.
- Applications Initiated – This section displays the total number of leads who have commenced filling out their application forms. A bar located below this count provides additional details: when hovered over, it shows a breakdown of these leads by their payment status, categorizing them as either “Payment Initiated” or “Payment Not Initiated”.
- Communications – This section displays the total number of communications exchanged between the user and each lead. When you hover over this number, a detailed breakdown appears, indicating the volume of communications released through different channels such as Email, WhatsApp, and SMS.
- Date Range – The entire top bar of the admin dashboard can be filtered by selecting a specific date range. Applying the date range filter updates all displayed metrics to reflect data only from the chosen period.
IMG 1.3
-
Channel Wise Performance
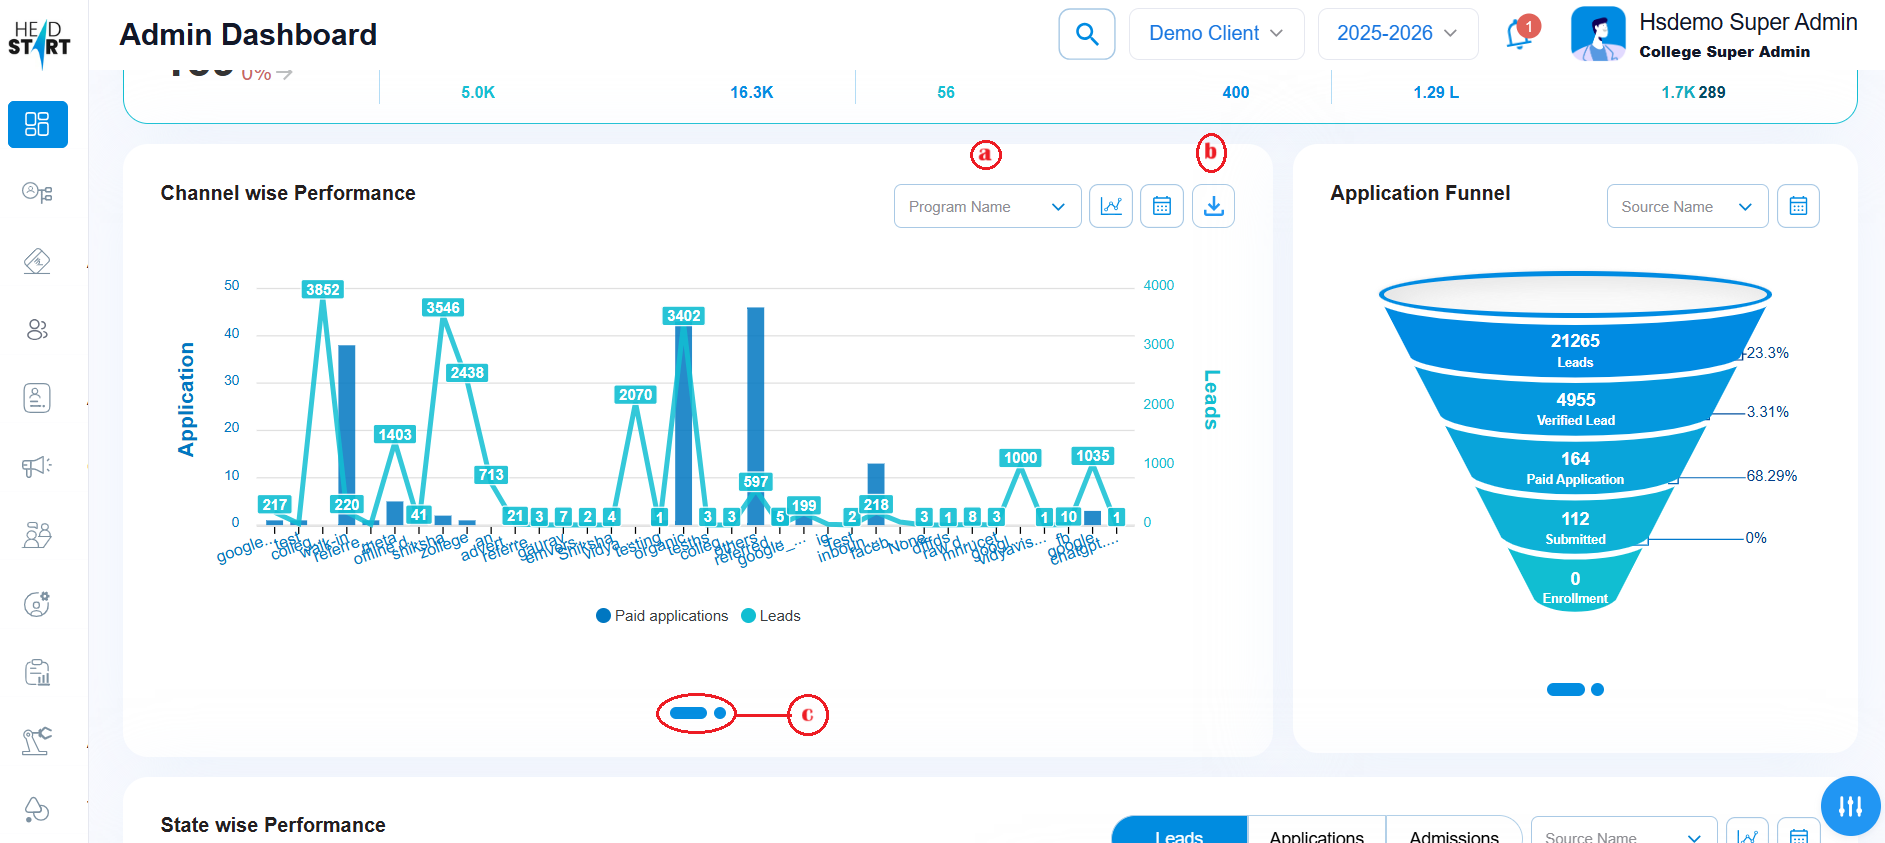
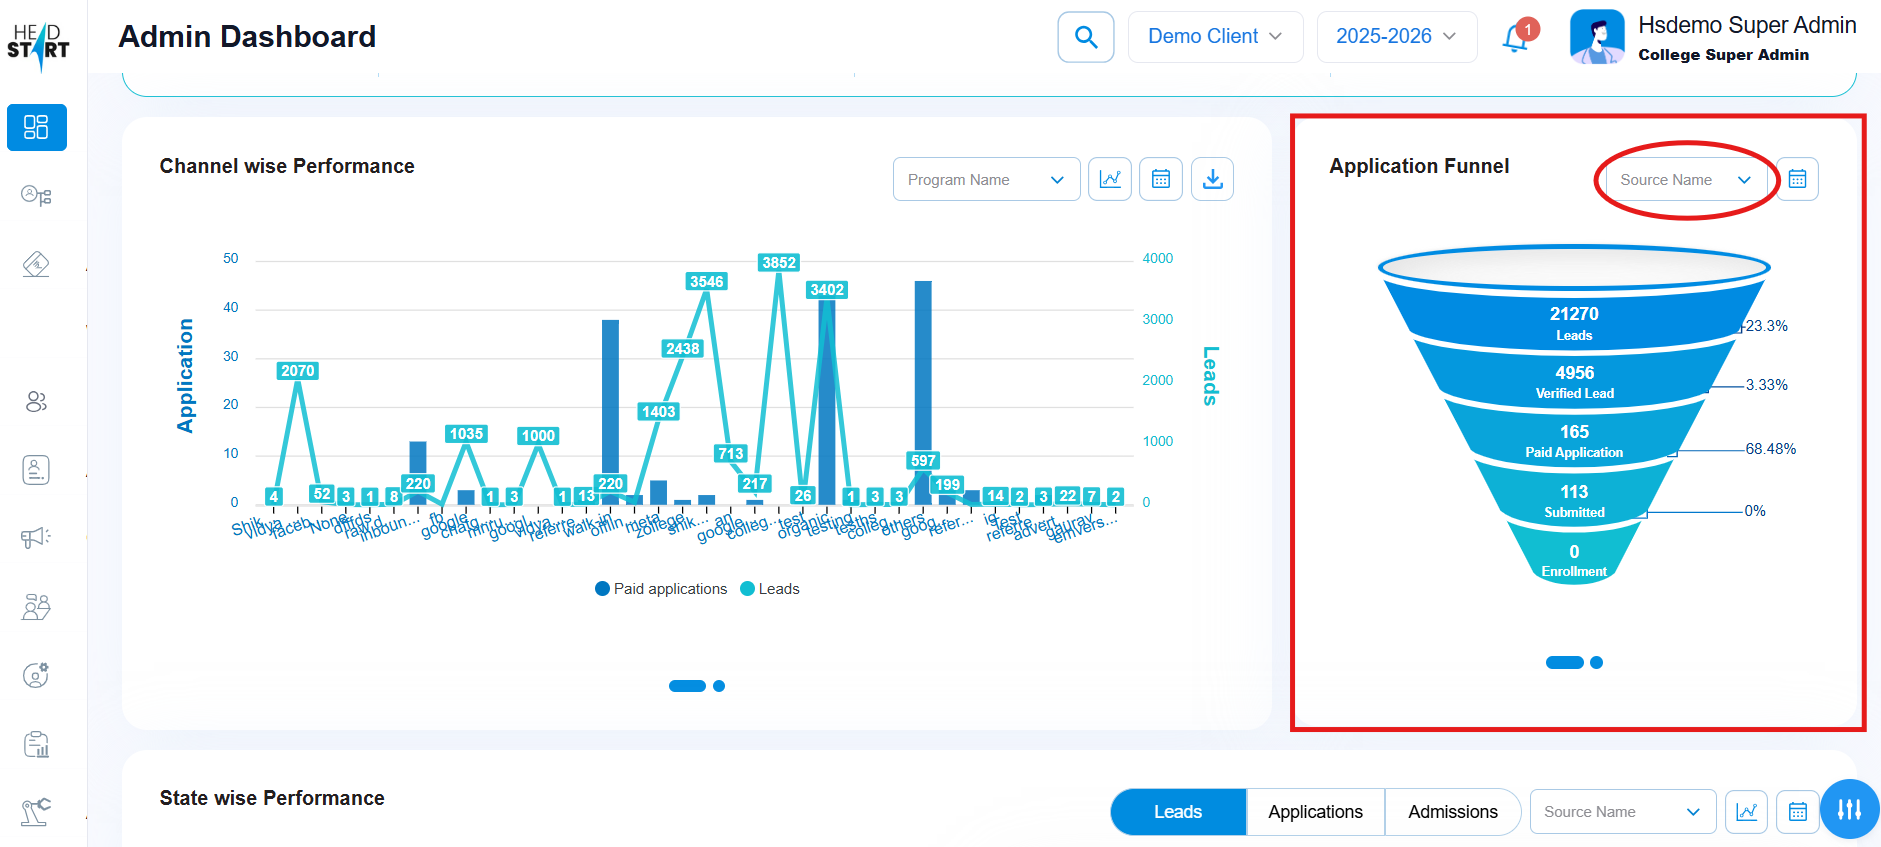
In the Admin Dashboard section, the Channel-wise Performance provides the user with information in a chart form on how many leads have been generated from each channel source(IMG 1.4)
- Channel performance can also be filtered based on specific program names. For example, you can filter the channel-wise performance to view results exclusively for the program “B.Sc. (Hons) in Medical Laboratory Technology(IMG 1.4).
- Users can download the complete channel-wise performance data by clicking the Download button. This feature enables easy access and offline analysis of detailed performance metrics for each channel(IMG 1.4).
- A small dot and bar are located below the channel-wise performance section. When clicked, they expand to reveal detailed channel performance information in a tabular format, providing a clear and organized view of the data(IMG 1.4), (IMG 1.4a)
IMG 1.4
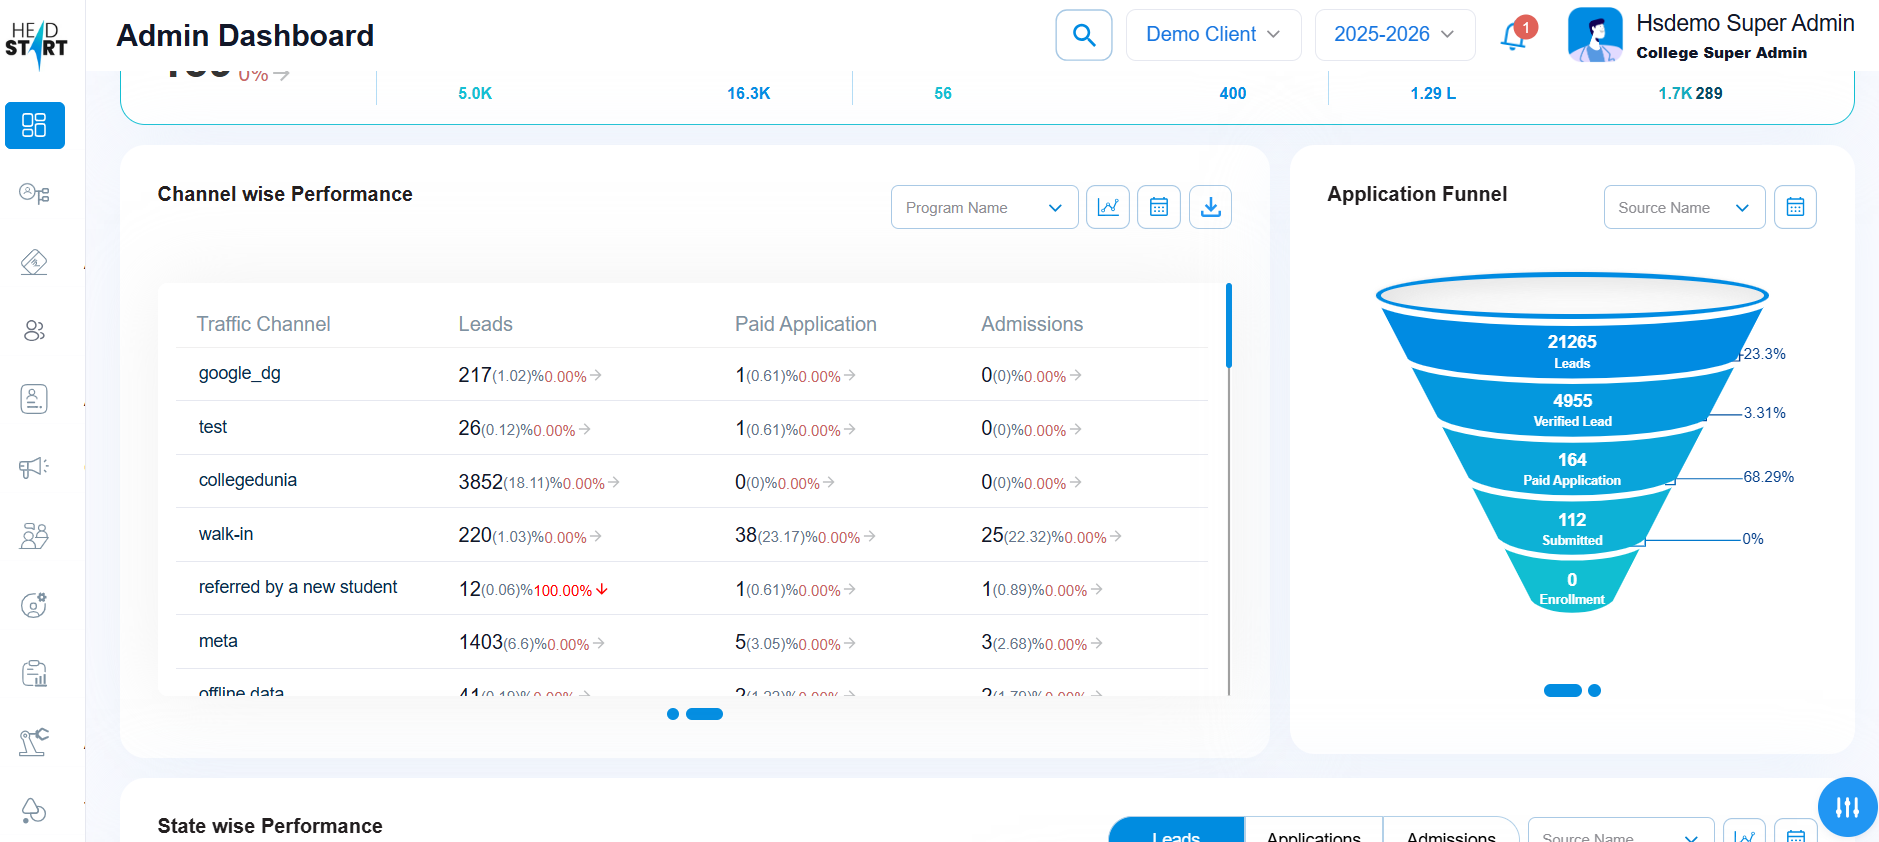
IMG 1.4a
-
Application Funnel
The application funnel provides users with insights into the percentage of leads progressing through each stage of the enrollment journey. Additionally, users can refine the funnel view by filtering results based on specific lead sources (IMG 1.5).
IMG 1.5
-
State Wise Performance
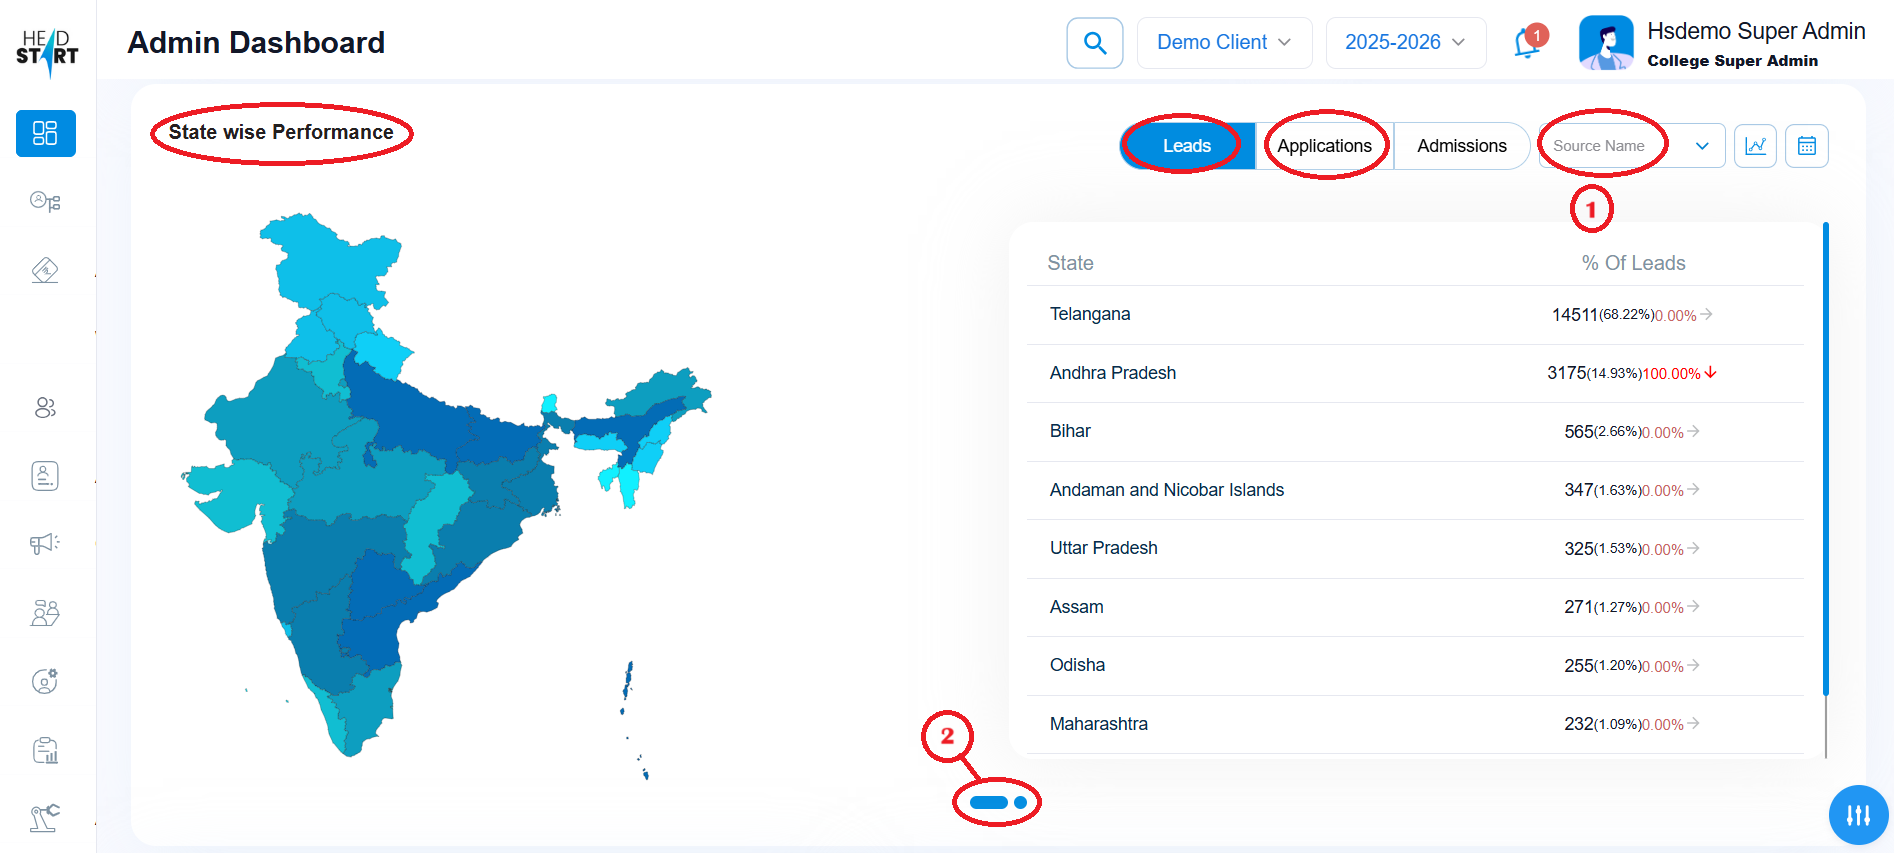
State Wise Performance informs you about the Leads/Applications generated from a particular state and how much percentage of the leads/applications are generated from this particular state out of all the leads.
- The user can filter out the state wise performance based on the source names.(IMG 1.6)
- The state wise performance can also display the whole information in tabular form as well, by clicking on the small button below the state wise section.(IMG 1.6).
IMG 1.6
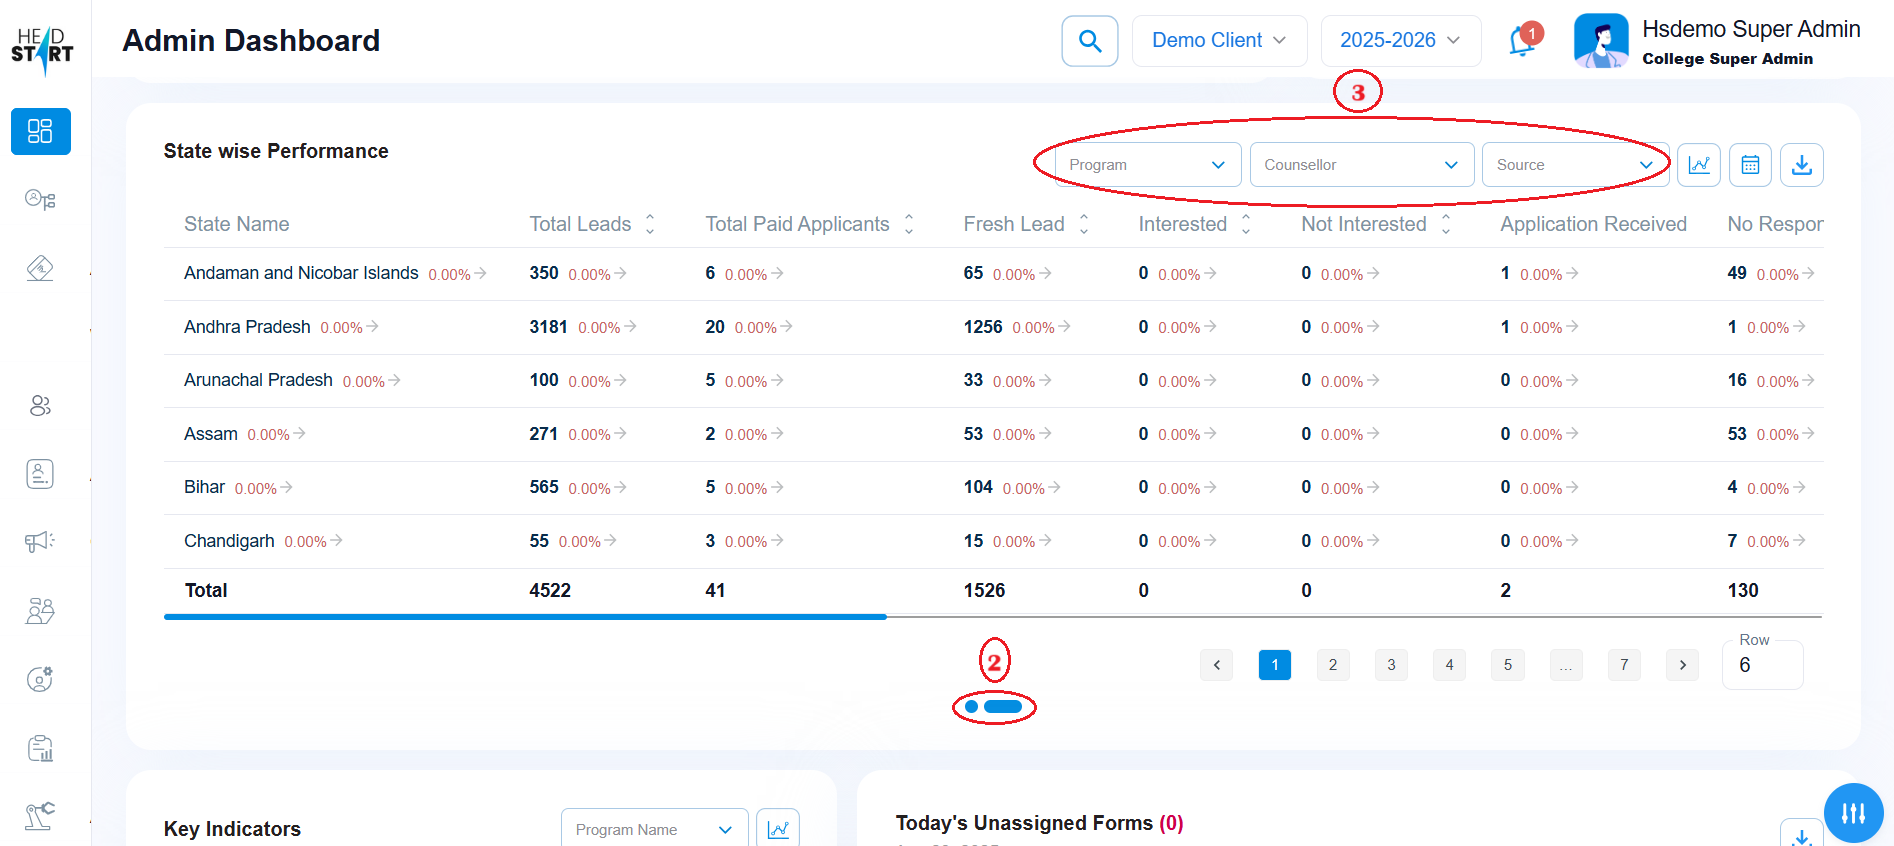
- Upon clicking on the button for the tabular view(IMG 1.6) of the state wise data the user is able filter out the data based on multiple filters which are program, counsellor and source.(IMG 1.7)
IMG 1.7
-
Key Indicators(First Page)
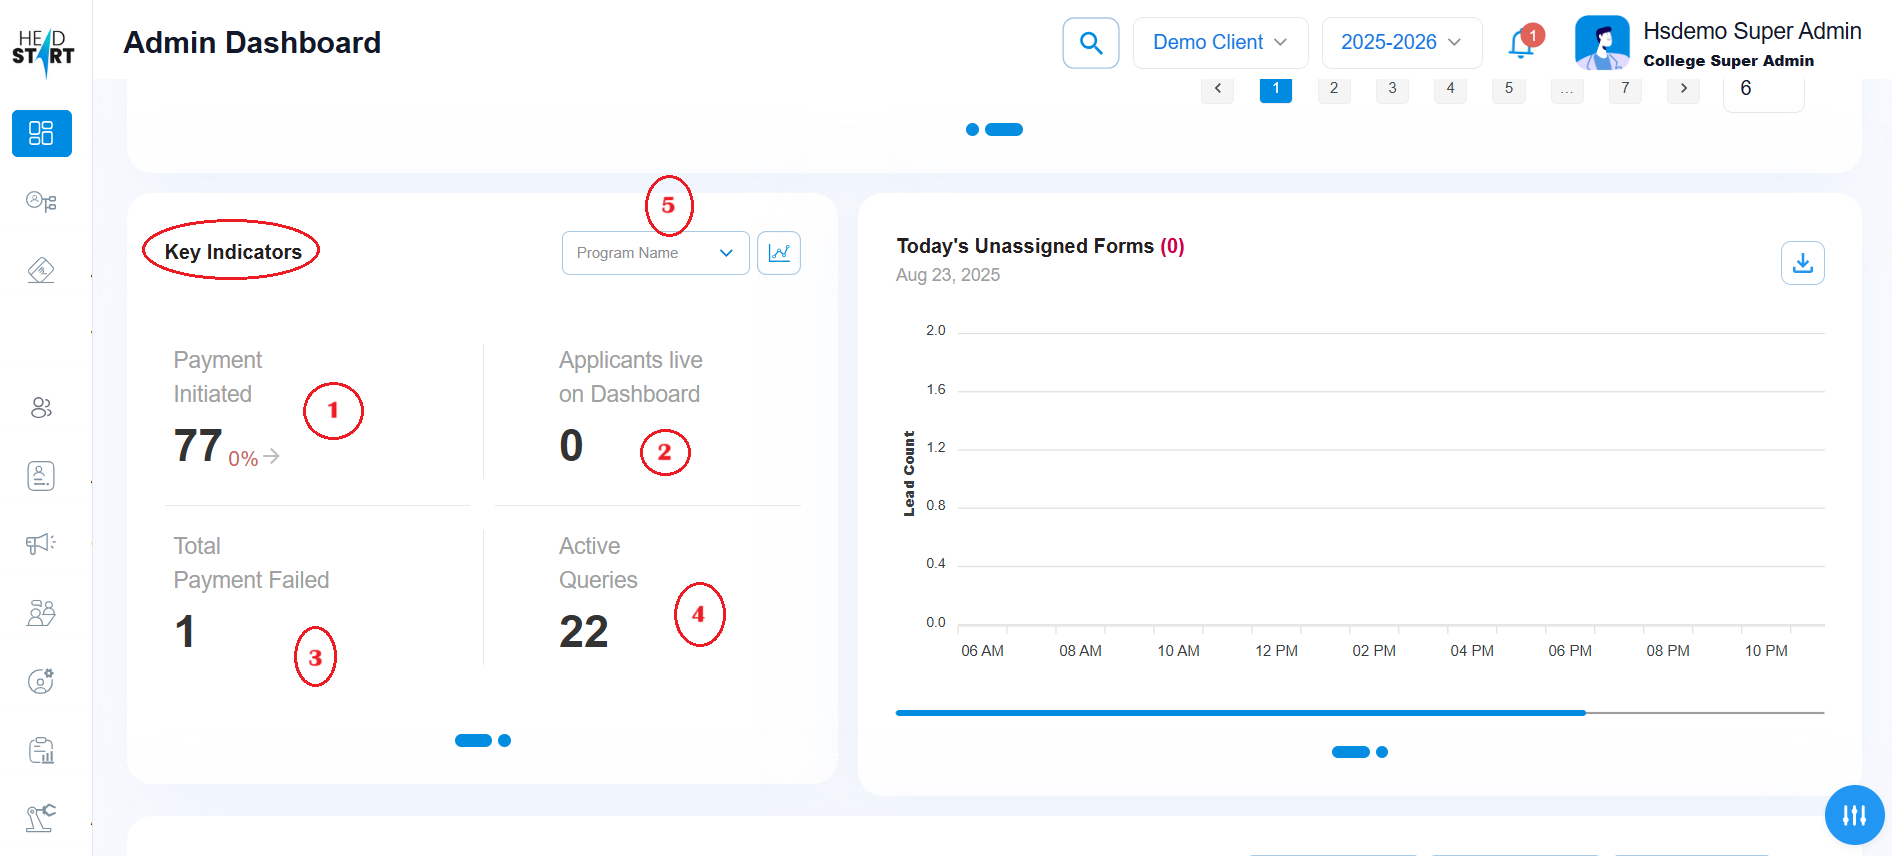
In this section, the user will get to know about the following data on the first page of key indicators(IMG 1.8):
- Payment Initiated – The number of users who reached the payment page, initiated the payment process, but were unsuccessful in completing the transaction.
- Applicants Live On Dashboard – the number of users who are currently live on the dashboard.
- Total Payment Failed – the number of users who could not complete the payment successfully.
- Active Queries – The total number of queries raised by students that have not yet been addressed.
- Program Name Filter – Users can also filter the key indicators on both the first and second pages by applying the Program Name filter.
IMG 1.8
-
Key Indicators(Second Page)
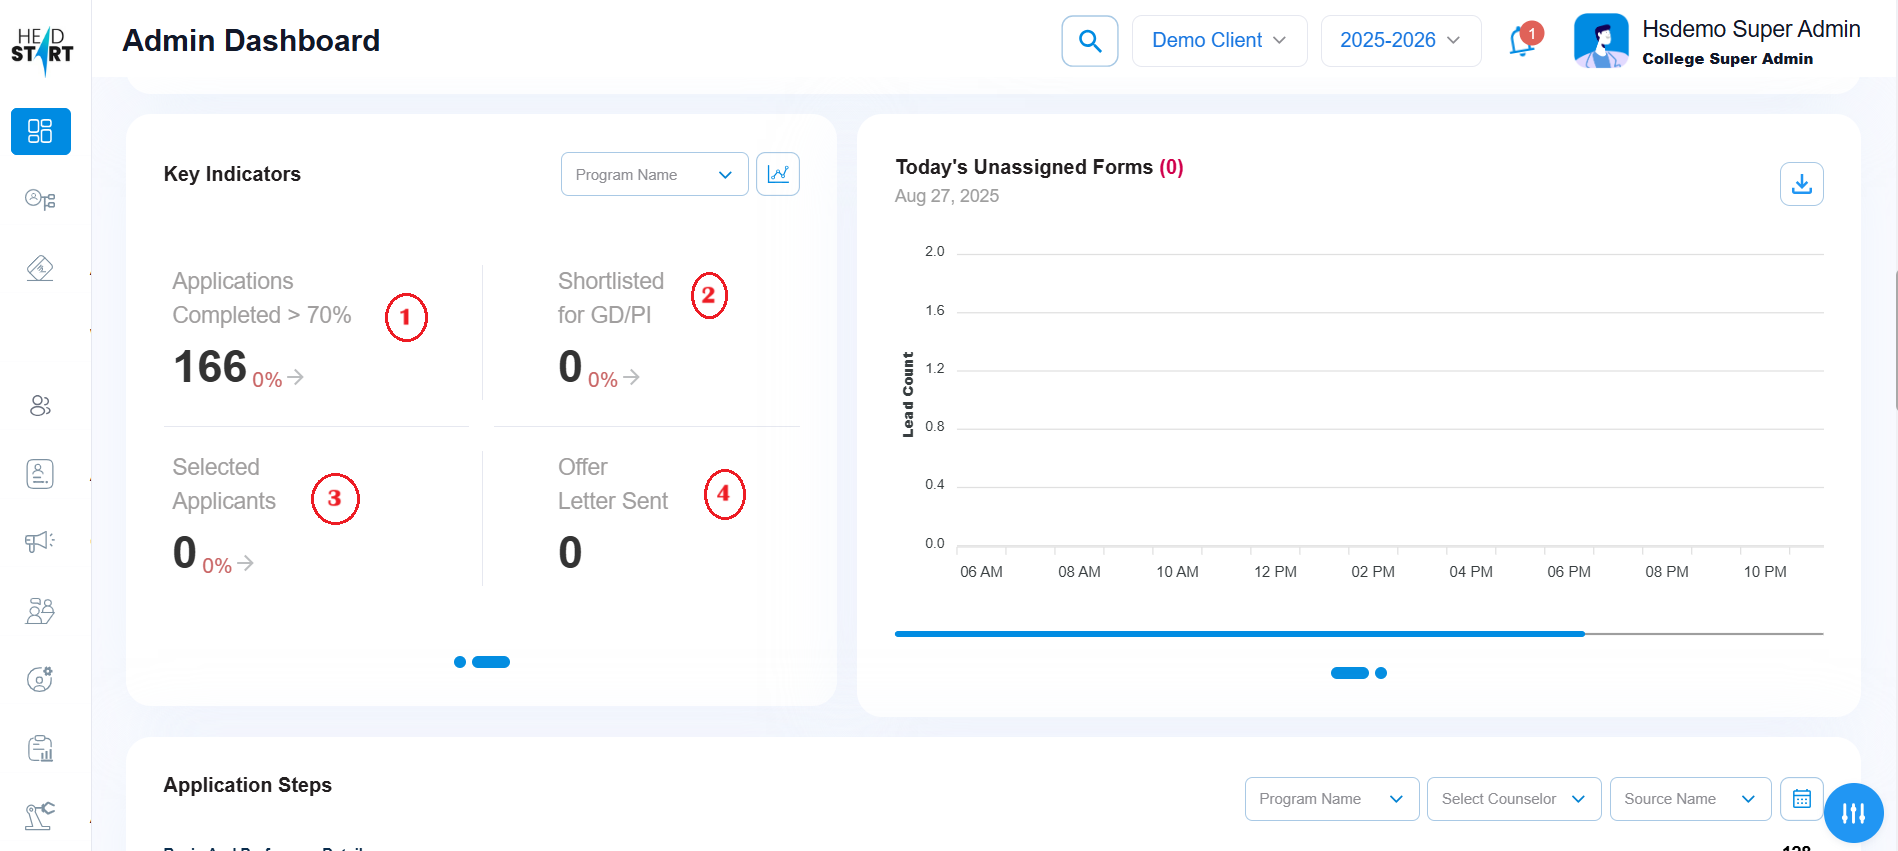
In this section, the user will get to know about the following data on the first page of key indicators(IMG 1.9):
- Applications completed >70% – The number of leads who have completed more than 70% of the application filling process.
- Shortlisted for GD/PI – Total number of leads who have been shortlisted for the GD/PI round.
- Selected Applicants – The number of candidates who have cleared the GD/PI.
- Offer Letter Sent – The number of leads who have completed the application process, made the payment, and received the offer letter.
IMG 1.9
-
Total and Today’s Unassigned Forms
In this section, users can view all leads that have not been assigned to any counsellor. The graph can be toggled between ‘Today’ and ‘Total’ by clicking the button located below the Unassigned Forms section. Within the ‘Today’s Unassigned Forms’ view, users can hover over the graph to see the count of both assigned and unassigned leads. Users can also view the total count by clicking on the number displayed next to the ‘Unassigned Forms’ label(IMG 2.0).
IMG 2.0
-
Application Steps
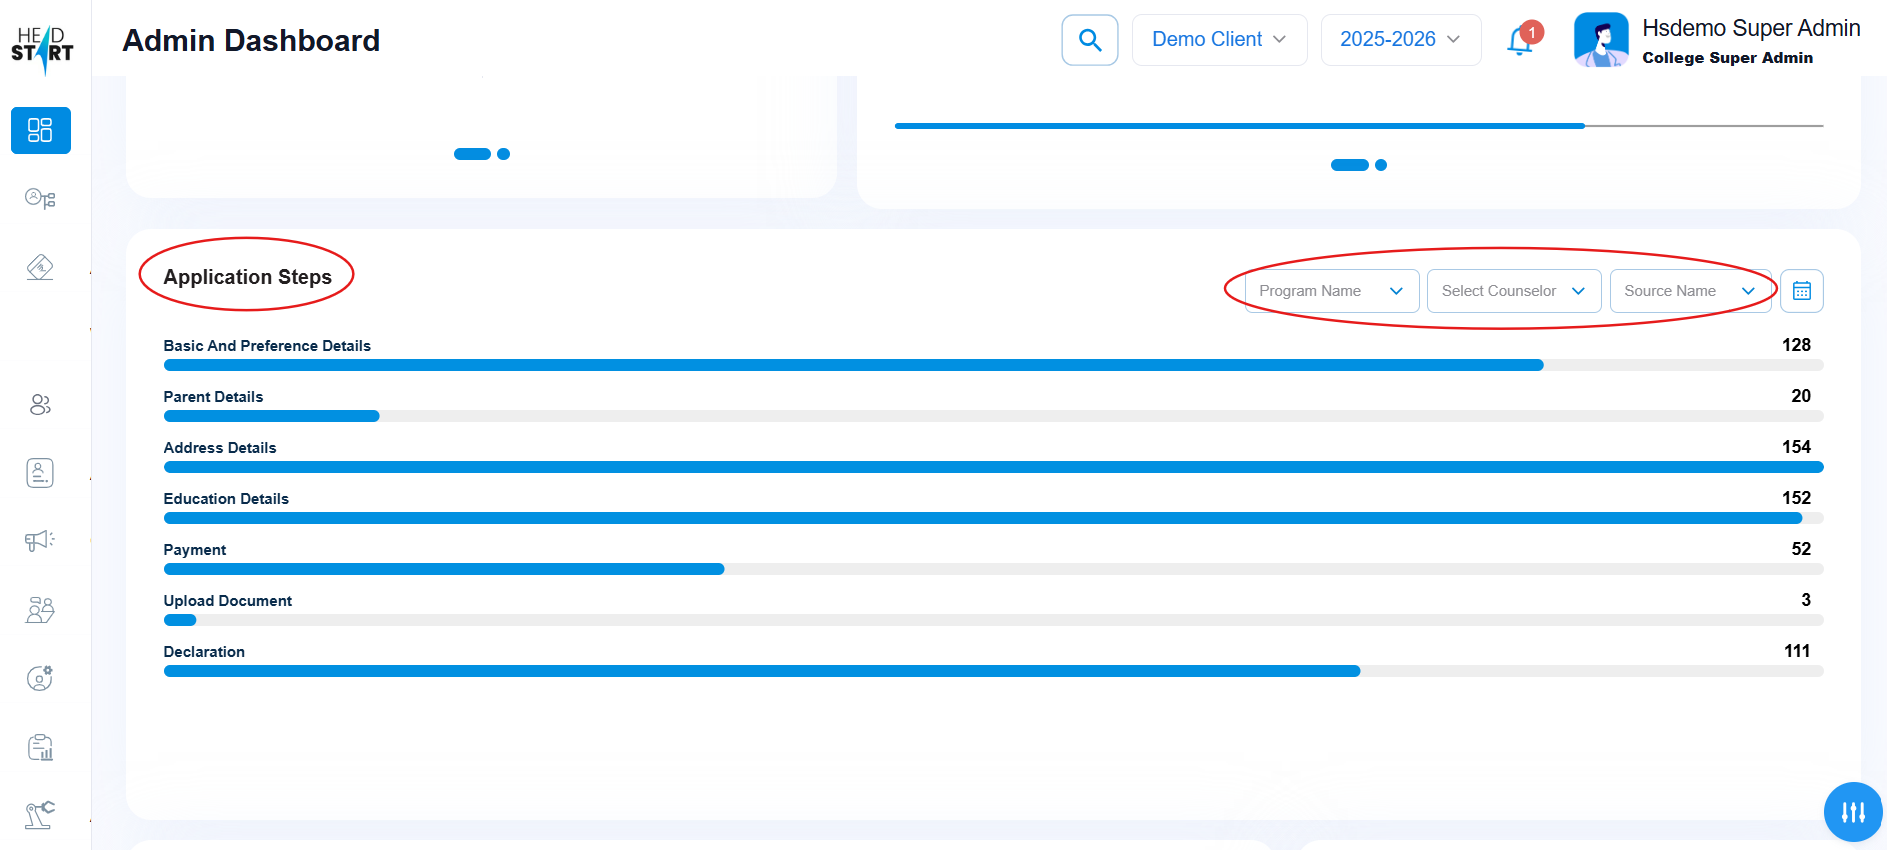
This section displays all the steps of the application process along with the number of leads at each respective step. Each number shown beside the steps is clickable and includes a redirection function for quick navigation(IMG 2.1)
Users also have the option to apply filters to refine data based on Program Name, Counsellor Name, and Source Name(IMG 2.1)
IMG 2.1
-
Leads vs Paid Applications
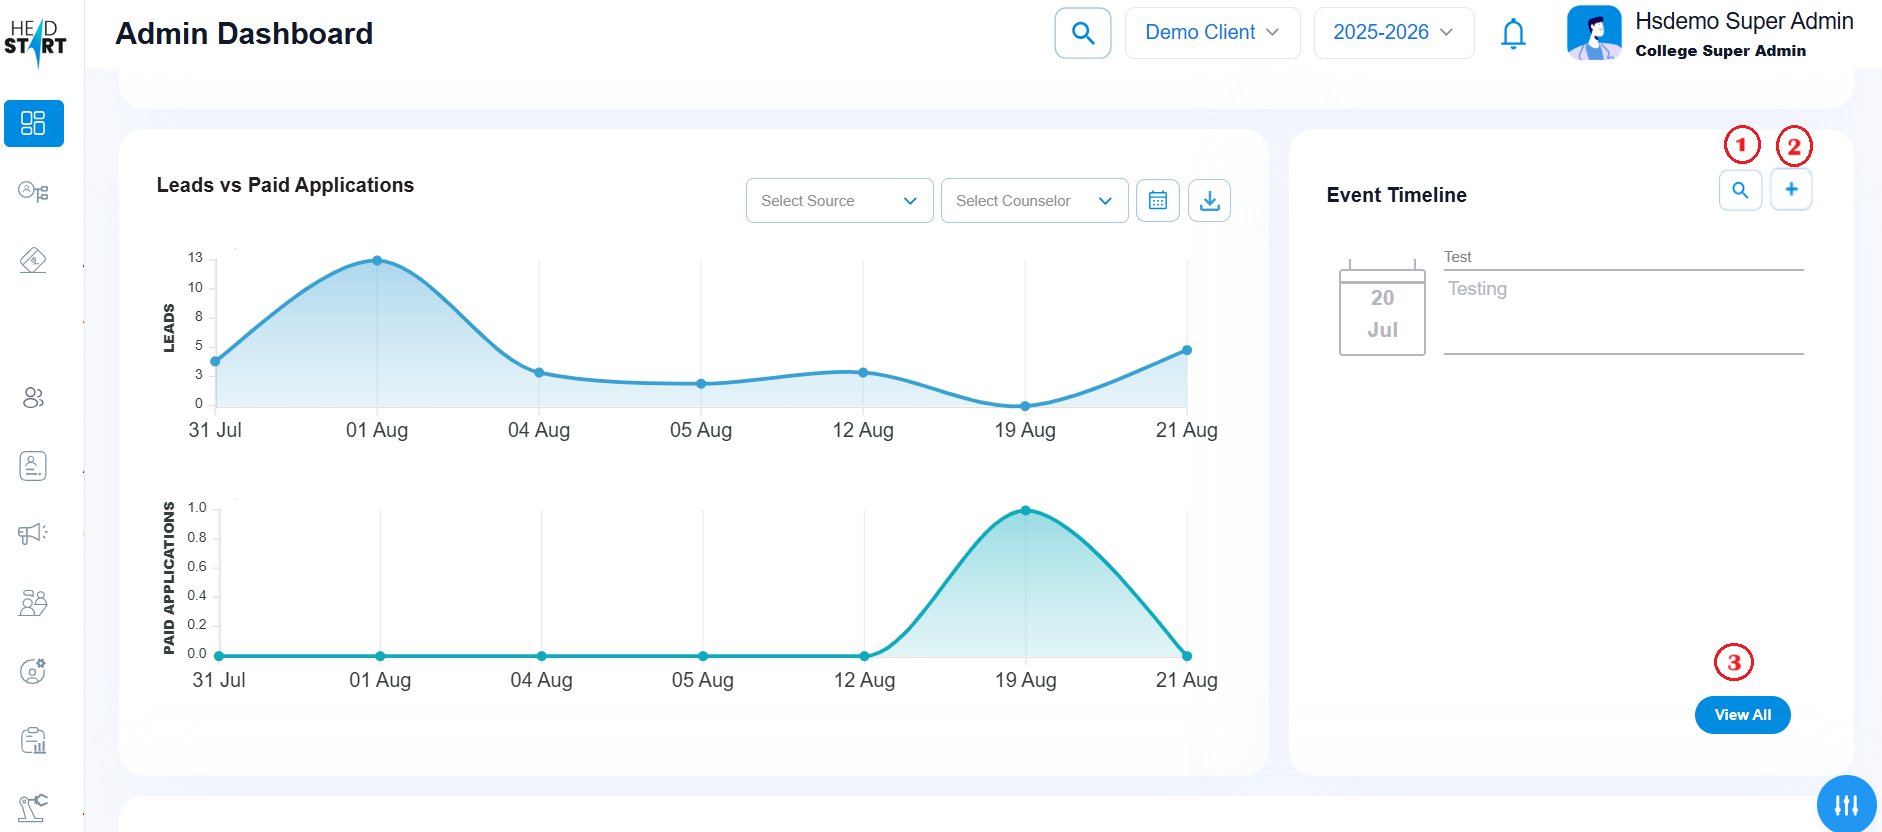
This chart displays the number of leads generated at each time point, alongside the number of paid applications generated during the same period(IMG 2.2)
- The chart can also be filtered out on the basis of source and counsellor name.
- Users can also apply a date range filter to refine the results
-
The entire chart can be downloaded for further use as well.
IMG 2.2
-
Event Timeline
This section represents the Event Timeline, where users can create events to analyze their impact by tracking lead status and the number of leads generated at a specific point in time. This enables users to evaluate whether the lead count increased or decreased following the event.(IMG 2.3)
- The user can search any event name by clicking on the search button(IMG 2.3)
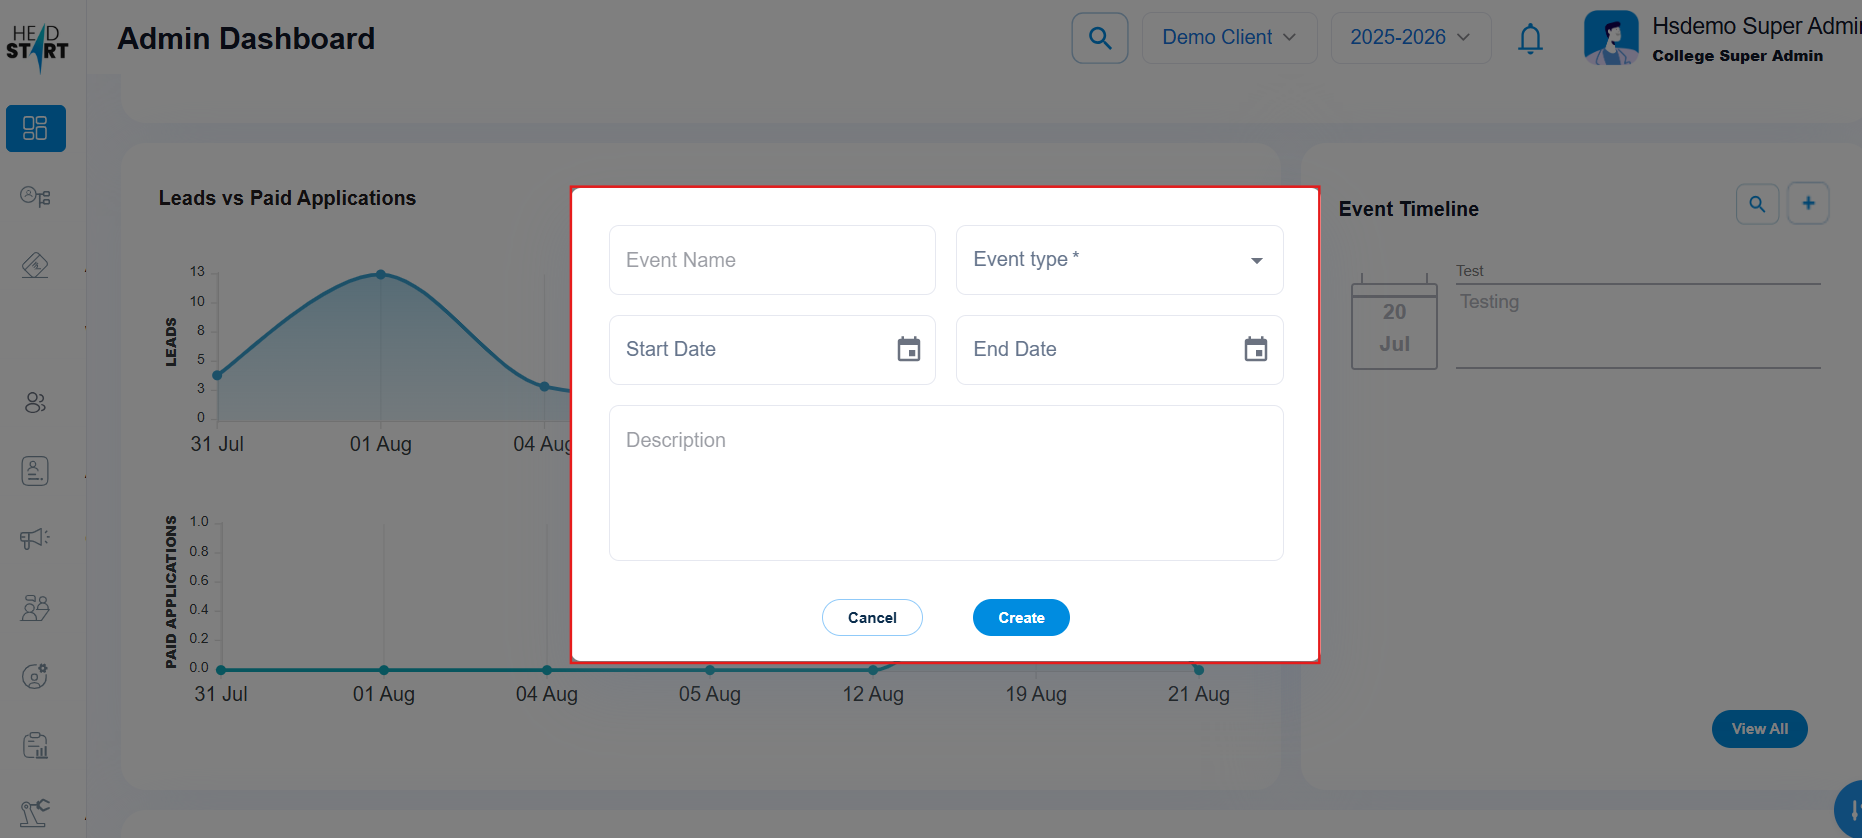
- The user can add any event by clicking on the plus button.(IMG 2.4)
- The user can search all the events by clicking on the view all button(IMG 2.3)
IMG 2.3
IMG 2.4
-
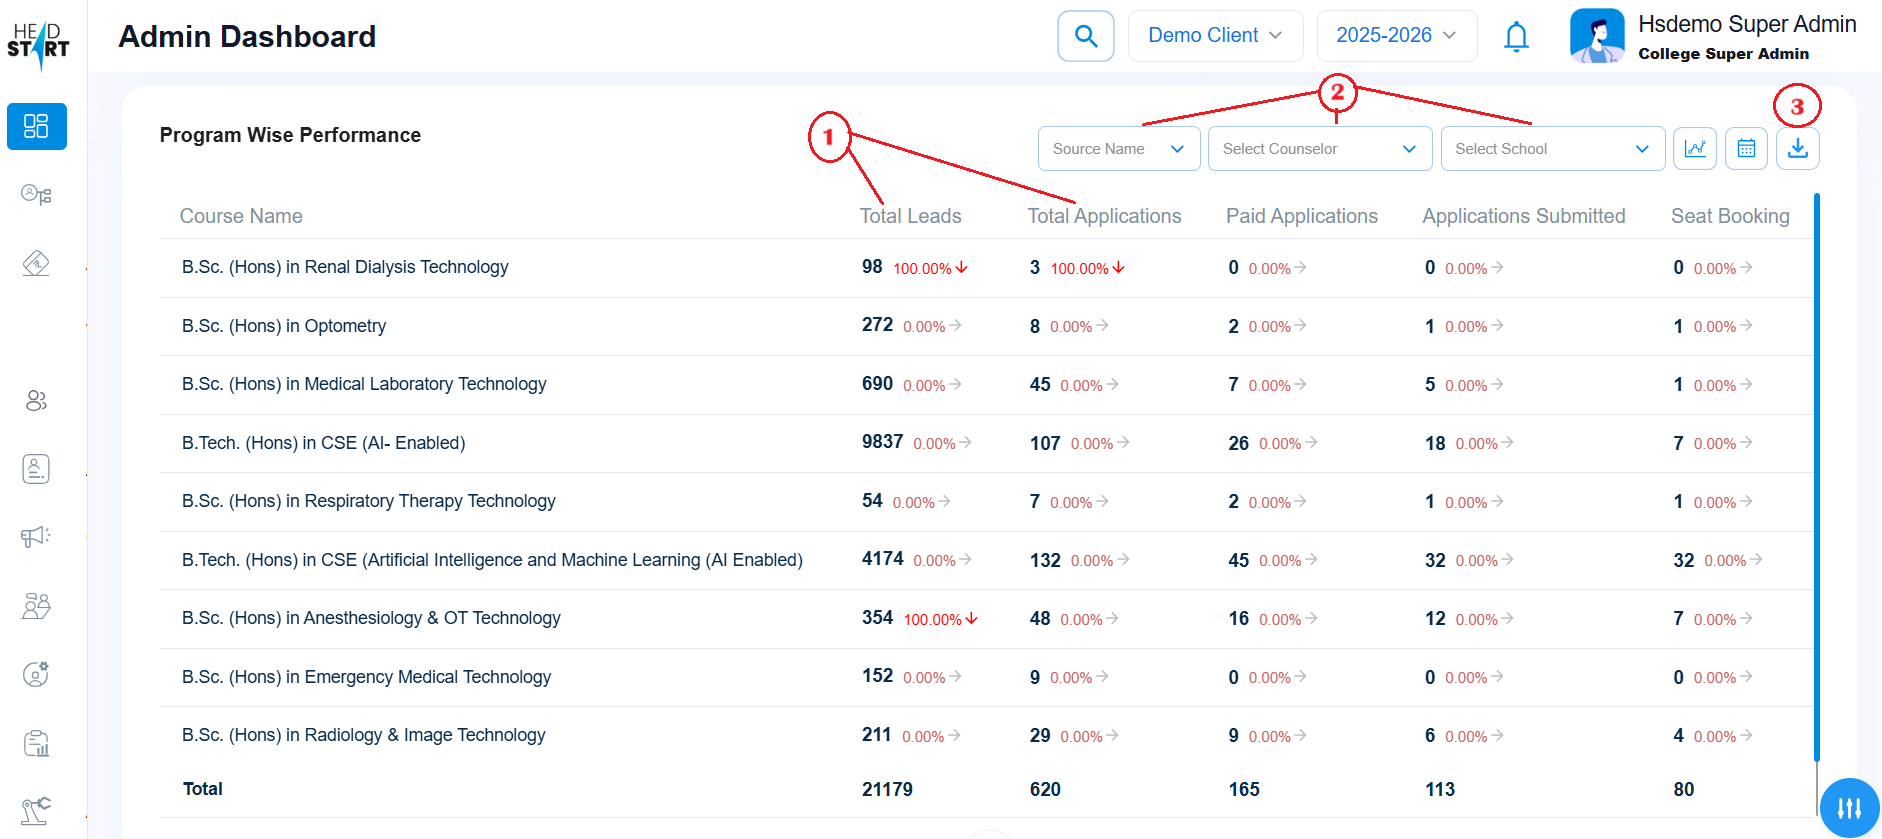
Program Wise Performance
In this section, users can view all program courses available in the CRM, along with insights into the performance of each program to date(IMG 2.5)
- In this section, users can view the total count of Leads, Applications, Paid Applications, Submitted Applications, and Seat Bookings(IMG 2.5)
- Data can be refined using the available filters, including Source, Counsellor, School, and Date Range(IMG 2.5)
- Users can download the data by clicking on the download icon(IMG 2.5)
IMG 2.5
-
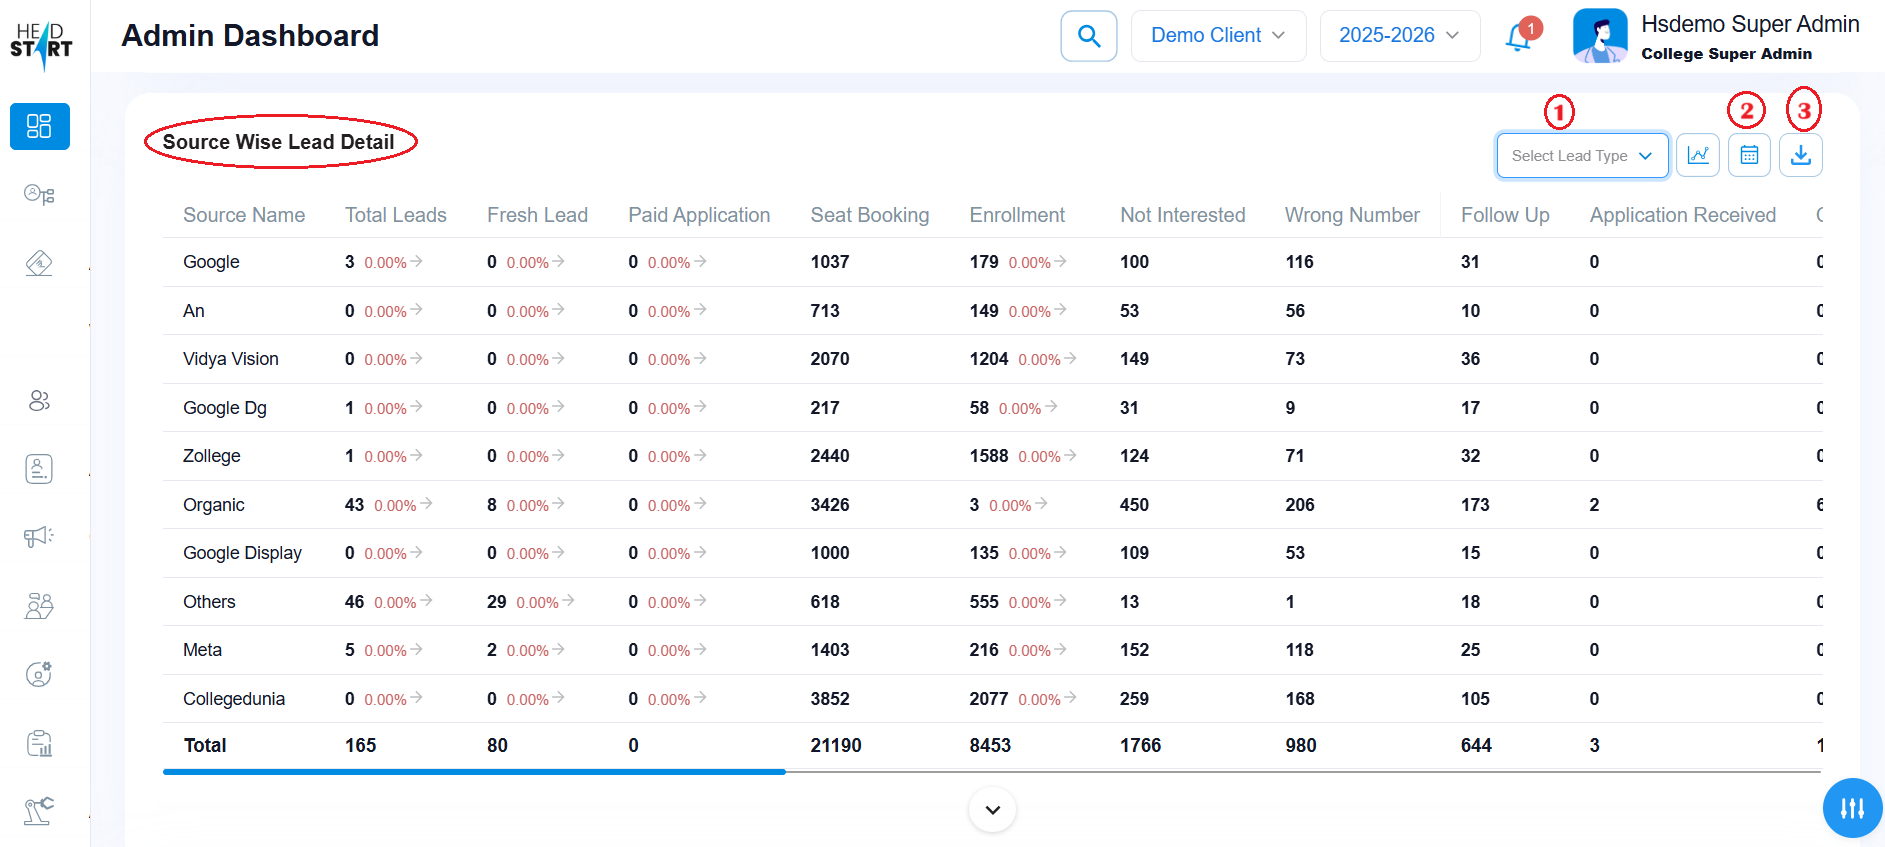
Source Wise Lead Detail
In this section, users can view the total count of lead generation across all sources. The data is further categorized by lead stages, with each stage displaying the number of leads generated from the respective source.
- Users can refine the data by applying the Lead Type filter
- Date range filter is also available
- The user can also download the data
IMG 2.6
-
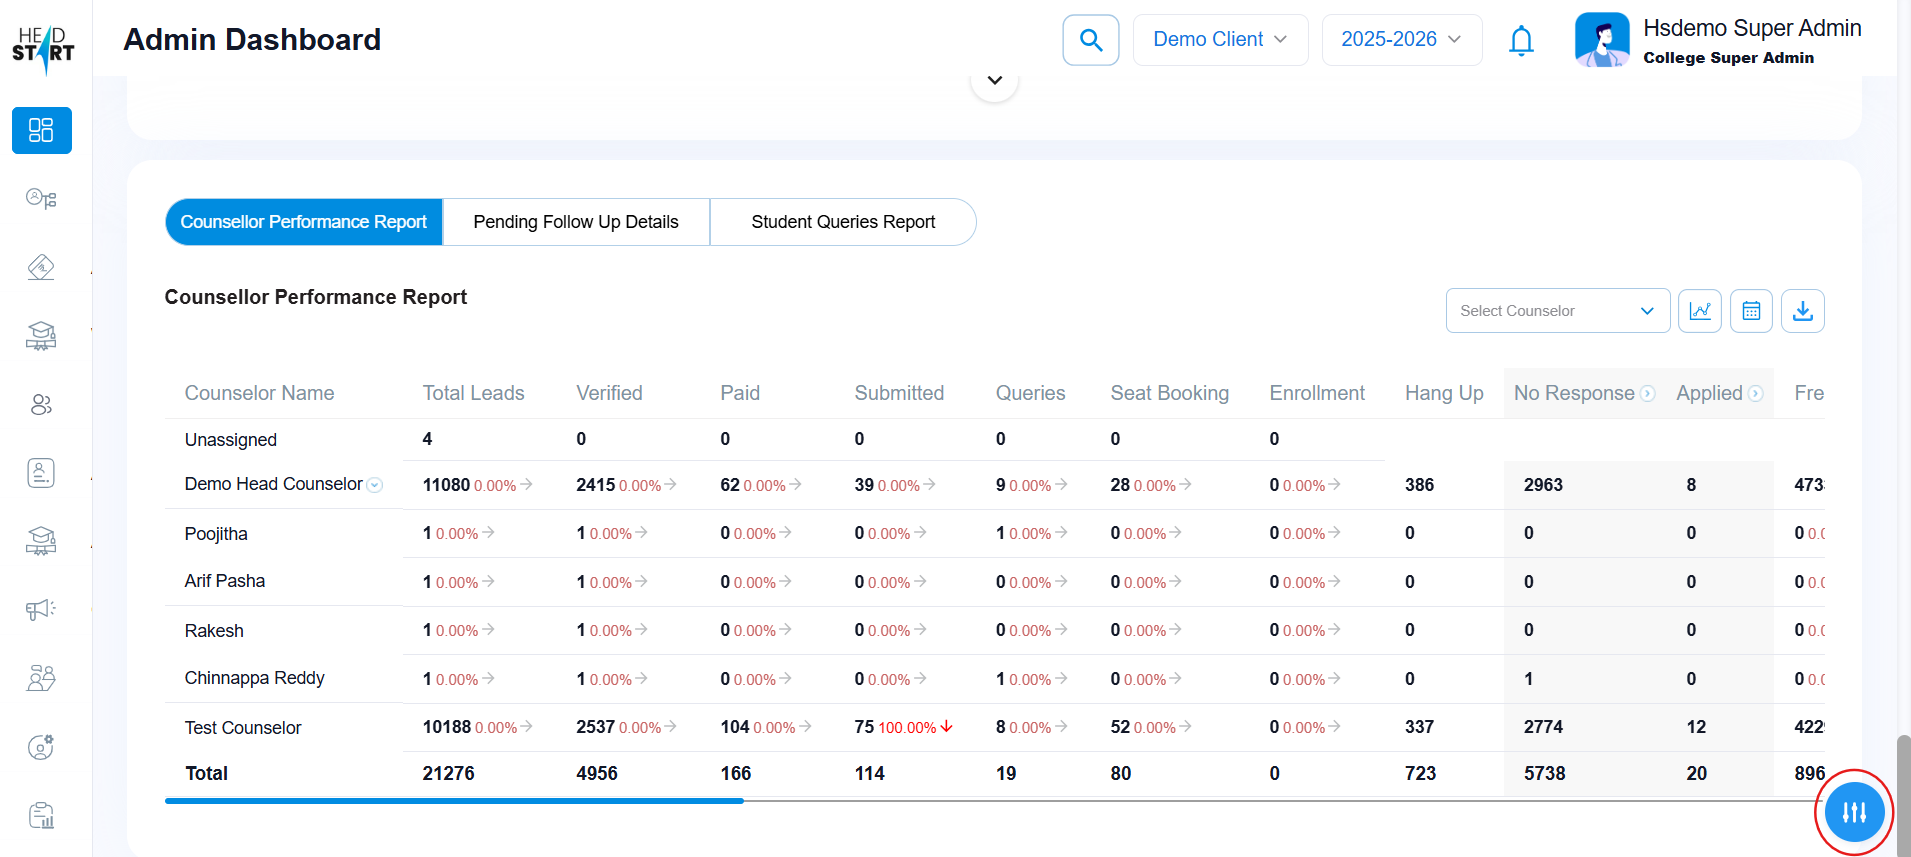
Counsellor Performance Report
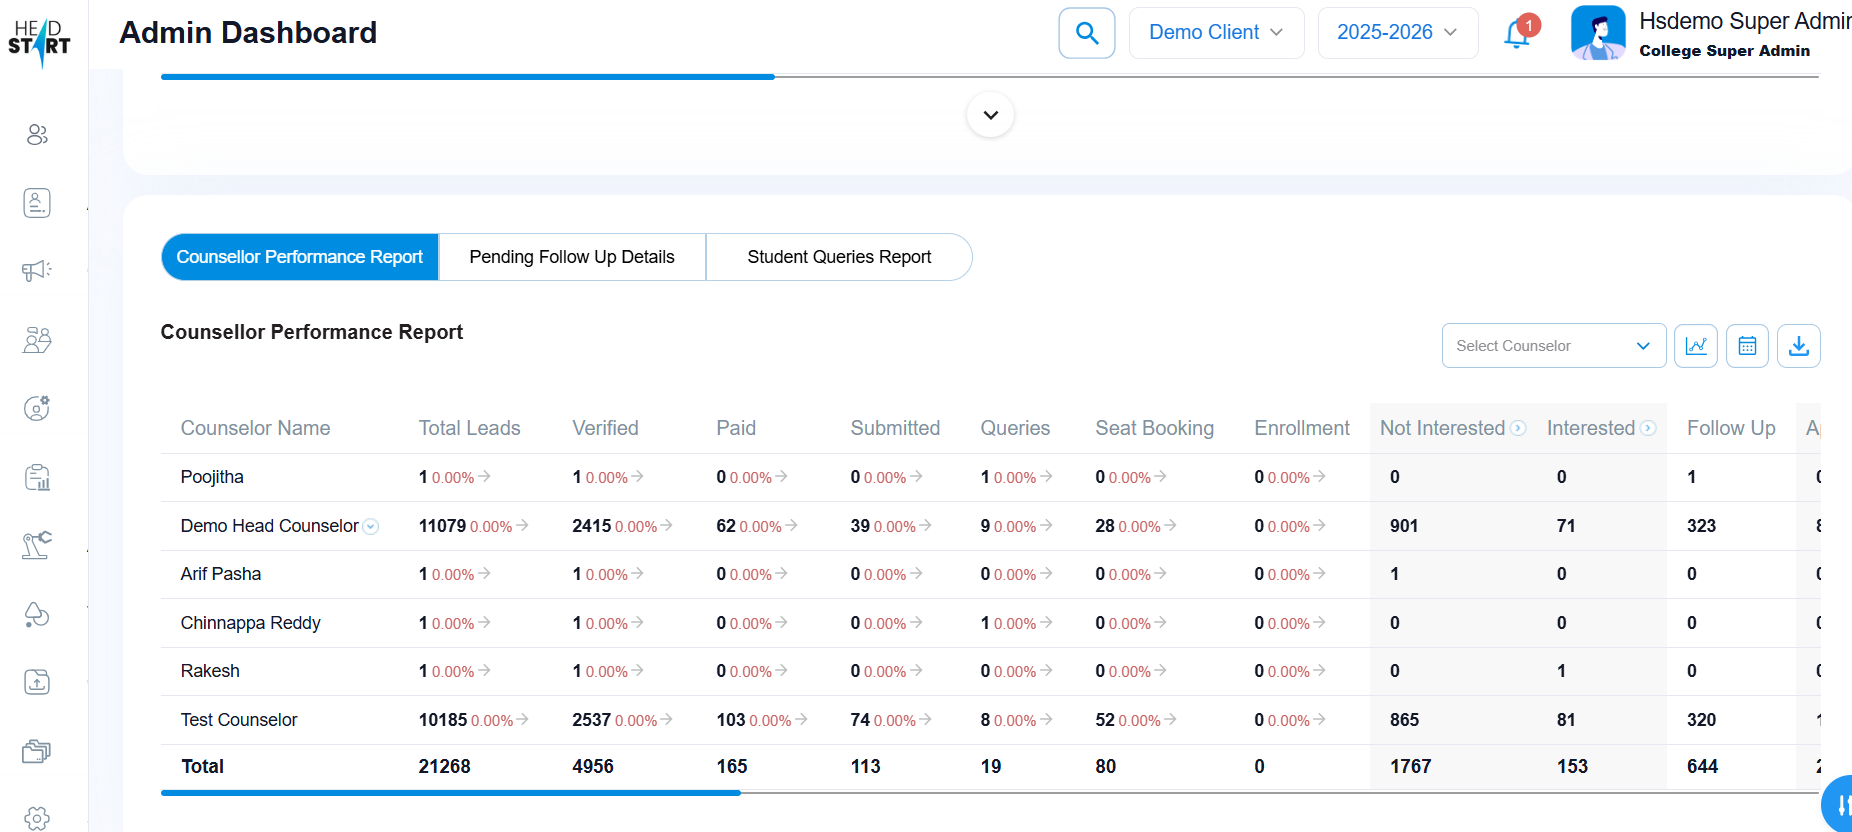
The Counselor Performance Report provides a comprehensive overview of each counselor’s activities, interactions, and effectiveness in engaging and converting leads. Users can further refine the data by applying the Counsellor Name filter to view performance for a specific counselor. The report can also be downloaded for reference or analysis.
IMG 2.7
-
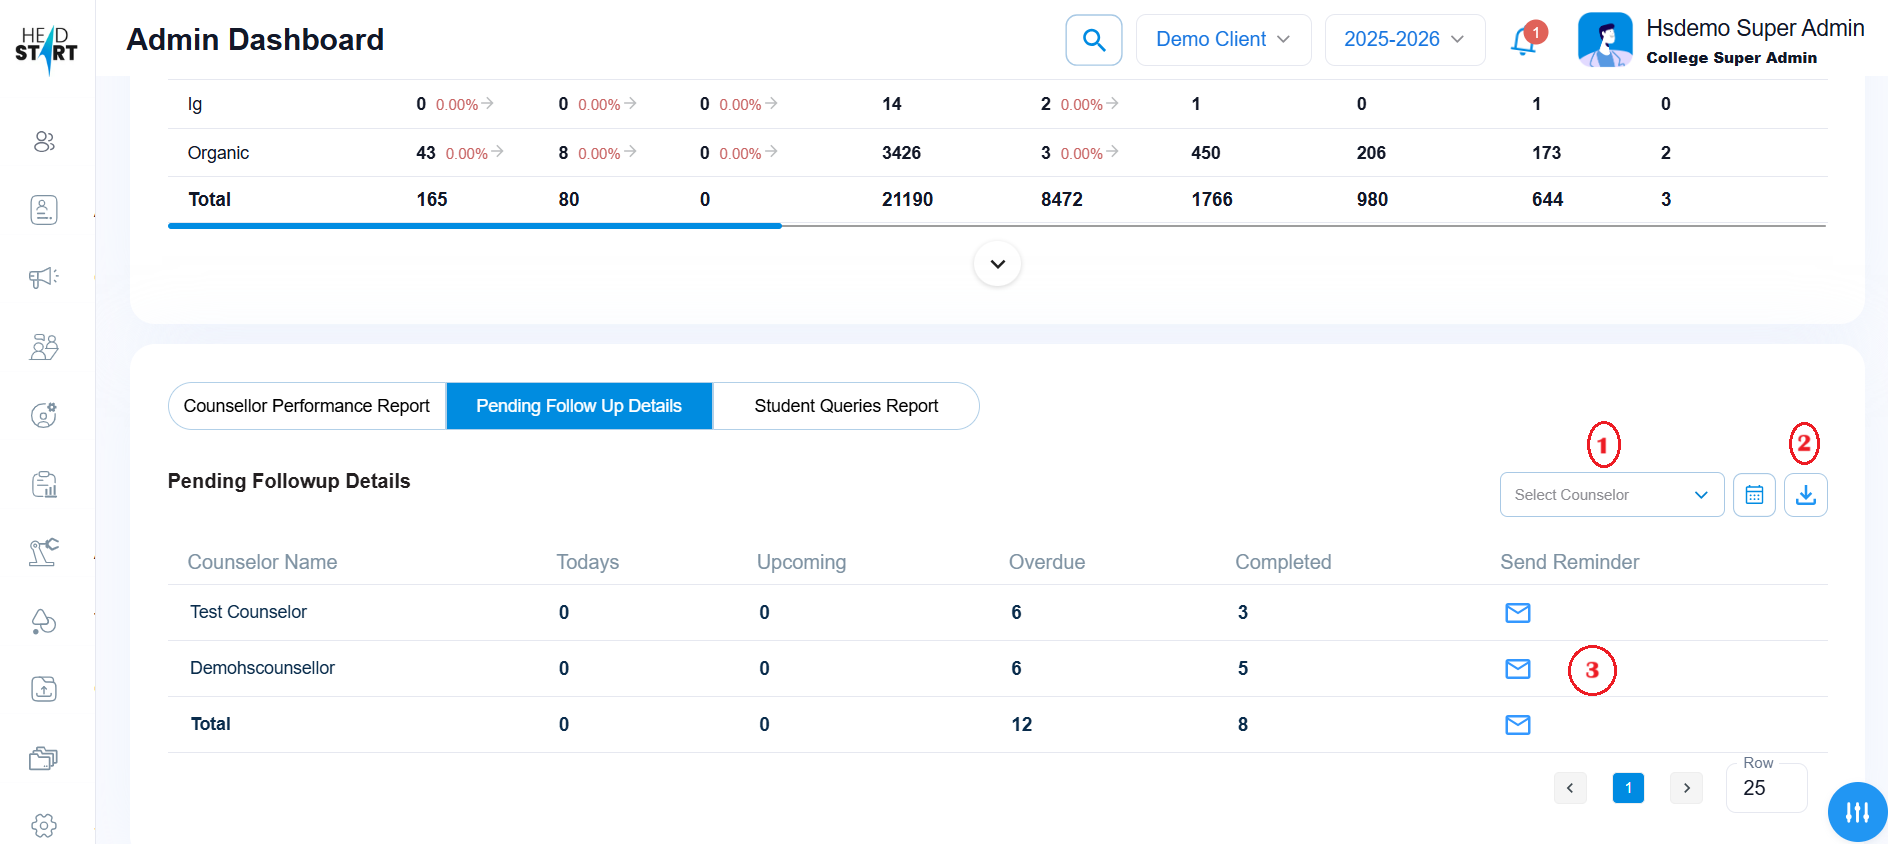
Pending Follow-Up Details
Pending follow-ups refer to the scheduled or overdue interactions that admissions counselors need to complete with prospective leads(IMG 2.8)
- Users can further refine the data by applying the Counsellor Name filter to view any follow-ups for a specific counselor(IMG 2.8)
- The pending follow-ups data can be downloaded also by clicking on the download symbol(IMG 2.8)
- If the user (admin) wishes to notify a specific counselor regarding their pending follow-ups—such as in cases where there are multiple overdue tasks—they can click the mail icon under the “Send Reminder” column. This action will trigger a pop-up window in the bottom-right corner of the screen, allowing the user to compose and send an email directly to the counselor.(IMG 2.8)
IMG 2.8
-
Student Queries Report
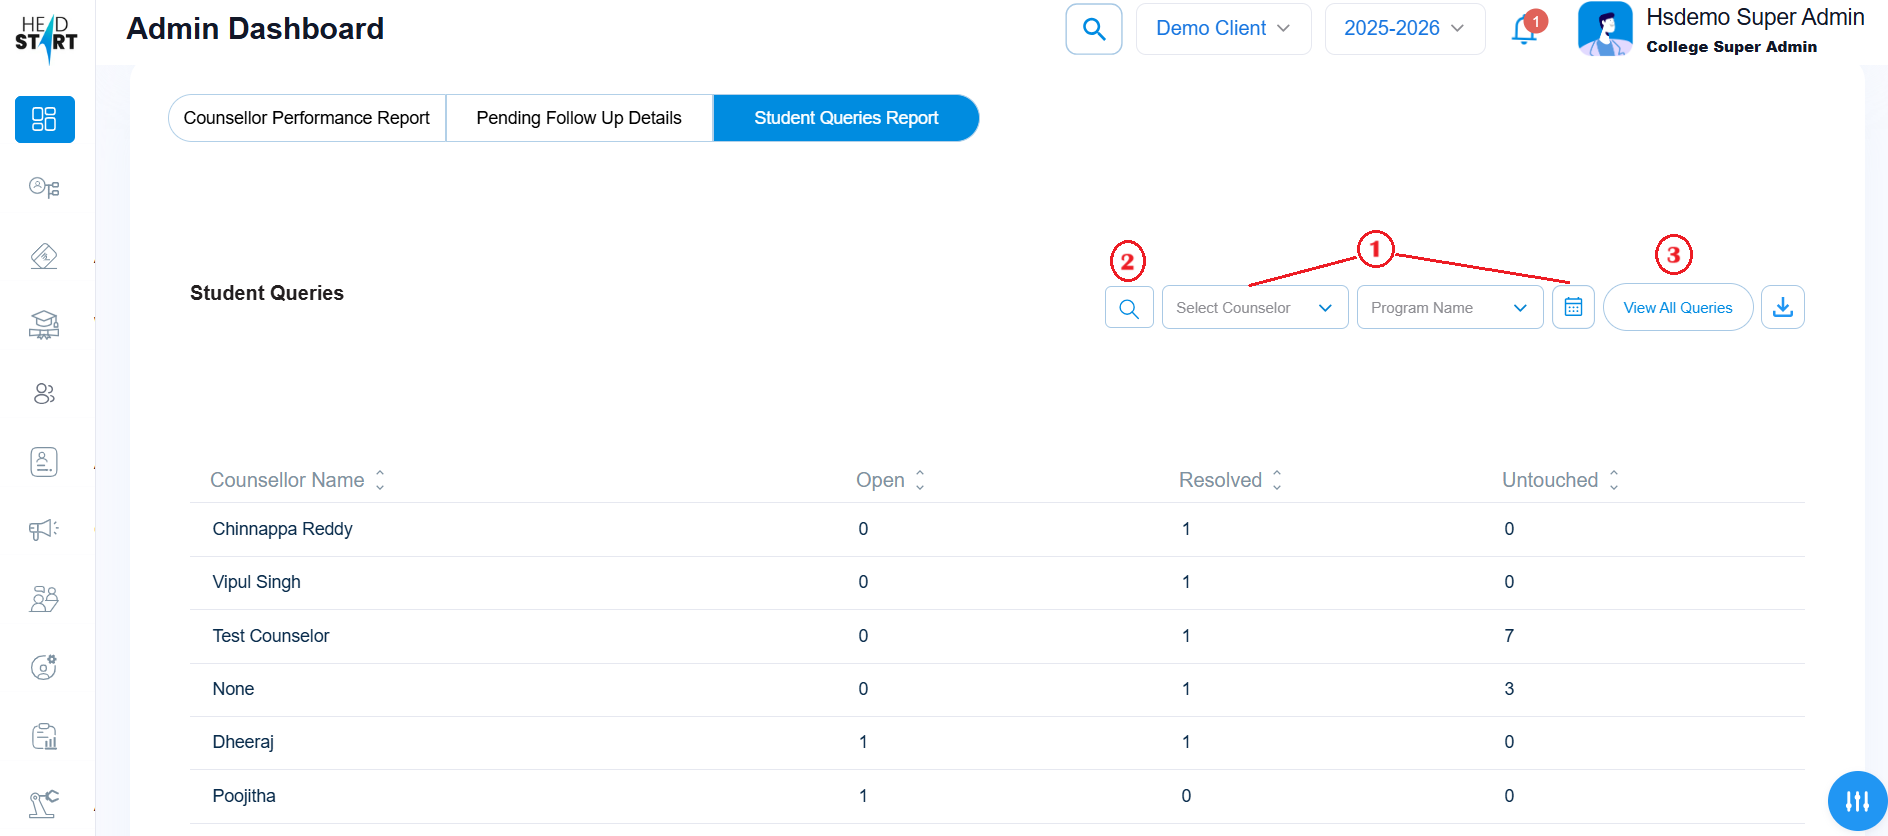
The Student Queries Report provides the user with a centralized view of all open,resolved and untouched queries raised by the leads(IMG 2.9)
- Users can refine the data by applying filters such as Counsellor, Program Name, and Date Range(IMG 2.9)
- Users can also perform a search by entering a Counsellor’s name(IMG 2.9)
- The user can view all the queries that are present in the system by clicking on the “view all queries” button(IMG 2.9)
IMG 2.9
-
Edit Layout
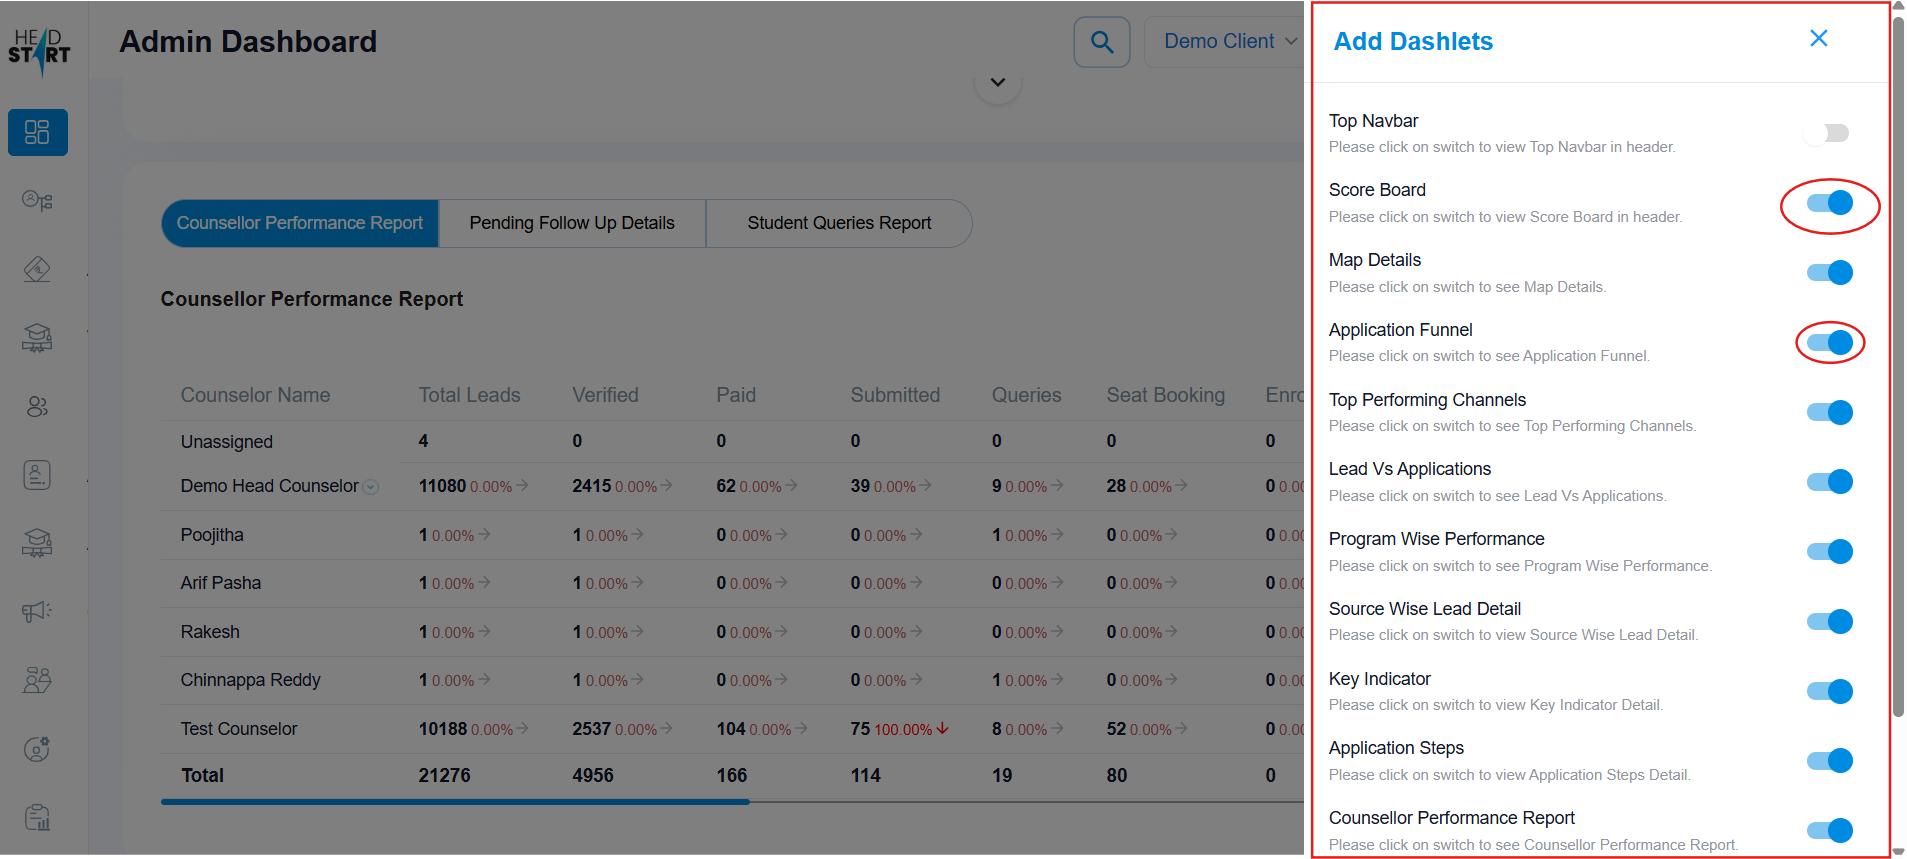
The user or admin can customize the dashboard layout by clicking the Edit Layout button (IMG 3.0) placed on the bottom right of the screen. This feature allows the admin to simplify and personalize the dashboard according to specific needs. Upon clicking the button, a side panel appears(IMG 3.1) displaying all available sections of the admin dashboard. Each section can be enabled or disabled using the toggle switch. The admin simply needs to turn on the toggles for the sections they wish to display, and then click Save to apply the changes.
IMG 3.0
IMG 3.1